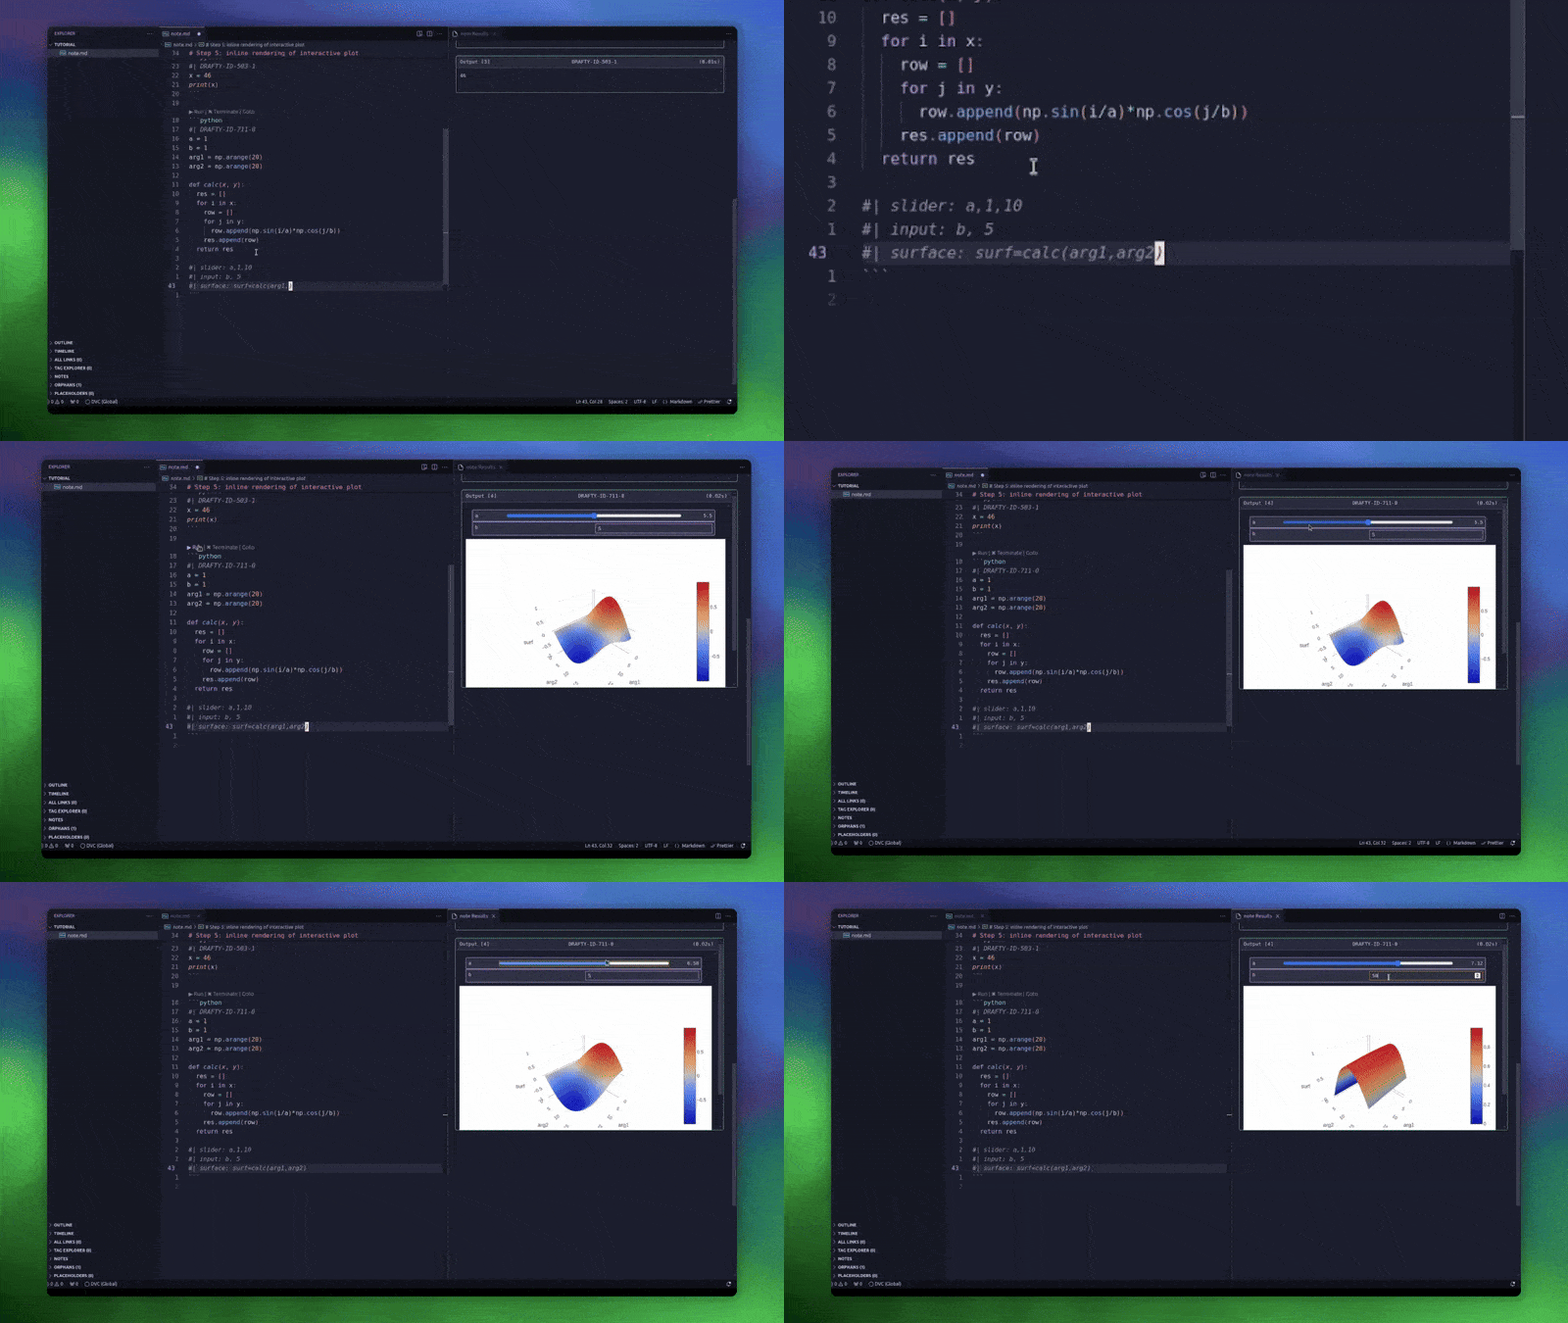
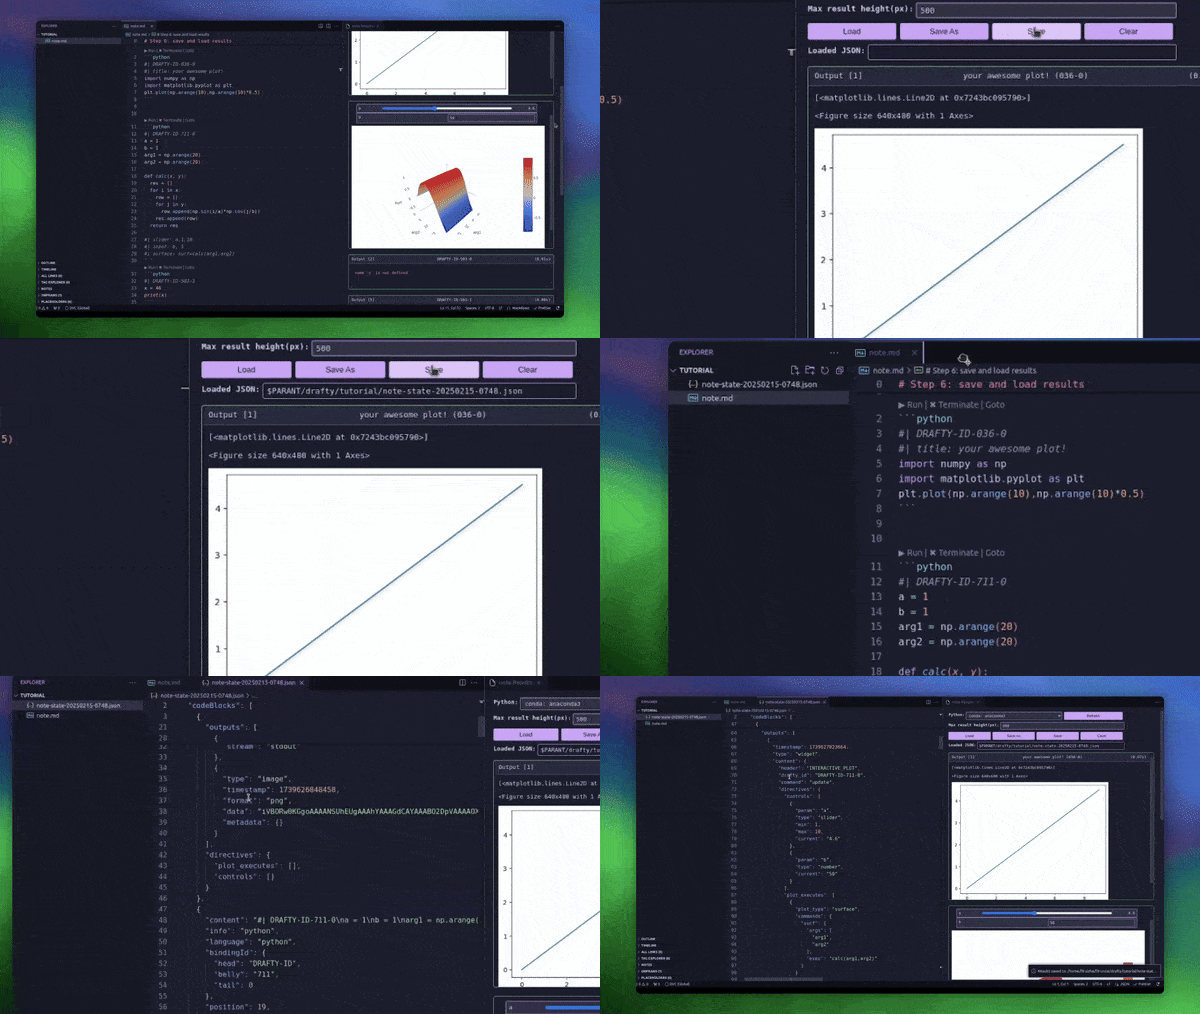
Drafty lets you run fenced python blocks in Markdown files, track session state across multiple runs, tinker interactive plots, and save / load execution results to/from JSON files.
- Install from VS Code marketplace by searching for "Drafty Runner"
- Or use the command:
code --install-extension fit-cnice.drafty
-
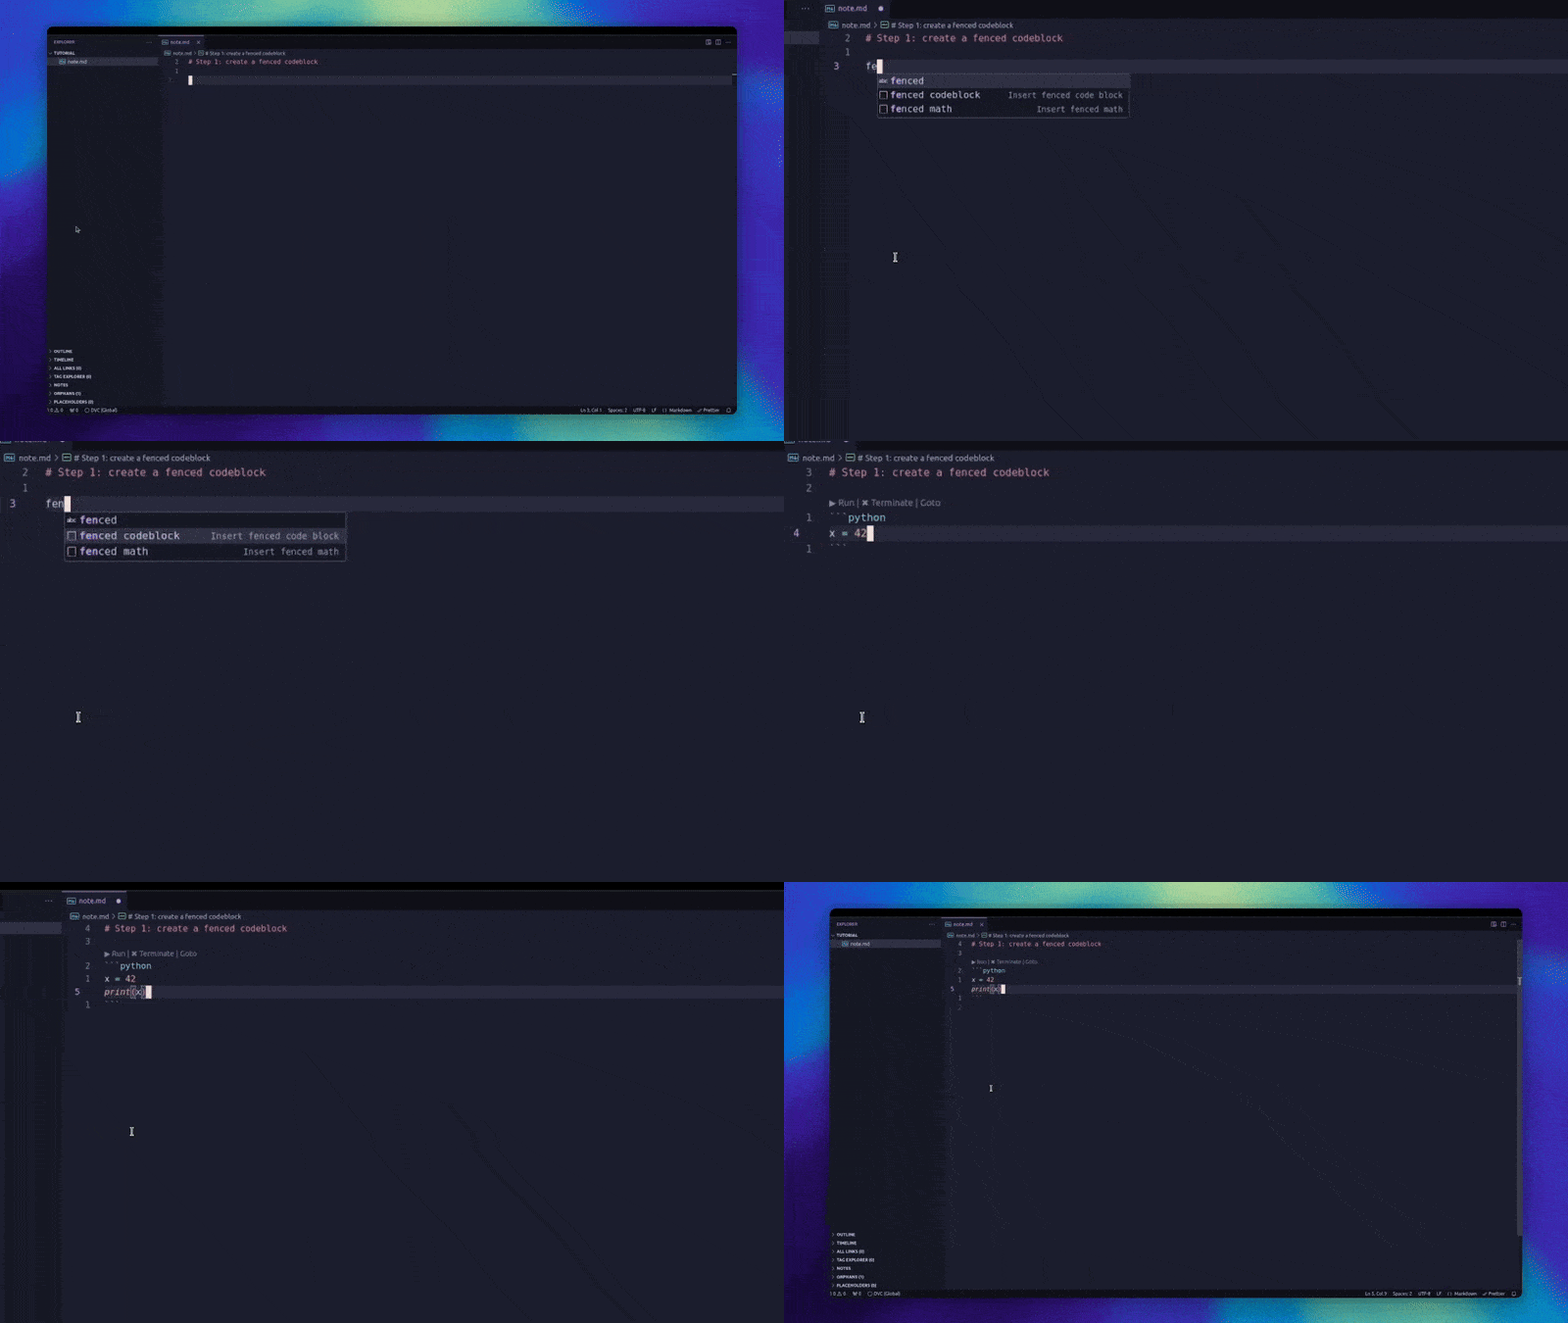
Create a fenced codeblock
- Thanks to
fenced codeblockssnippet in VSCode, you can create python code blocks easily
- Thanks to
-
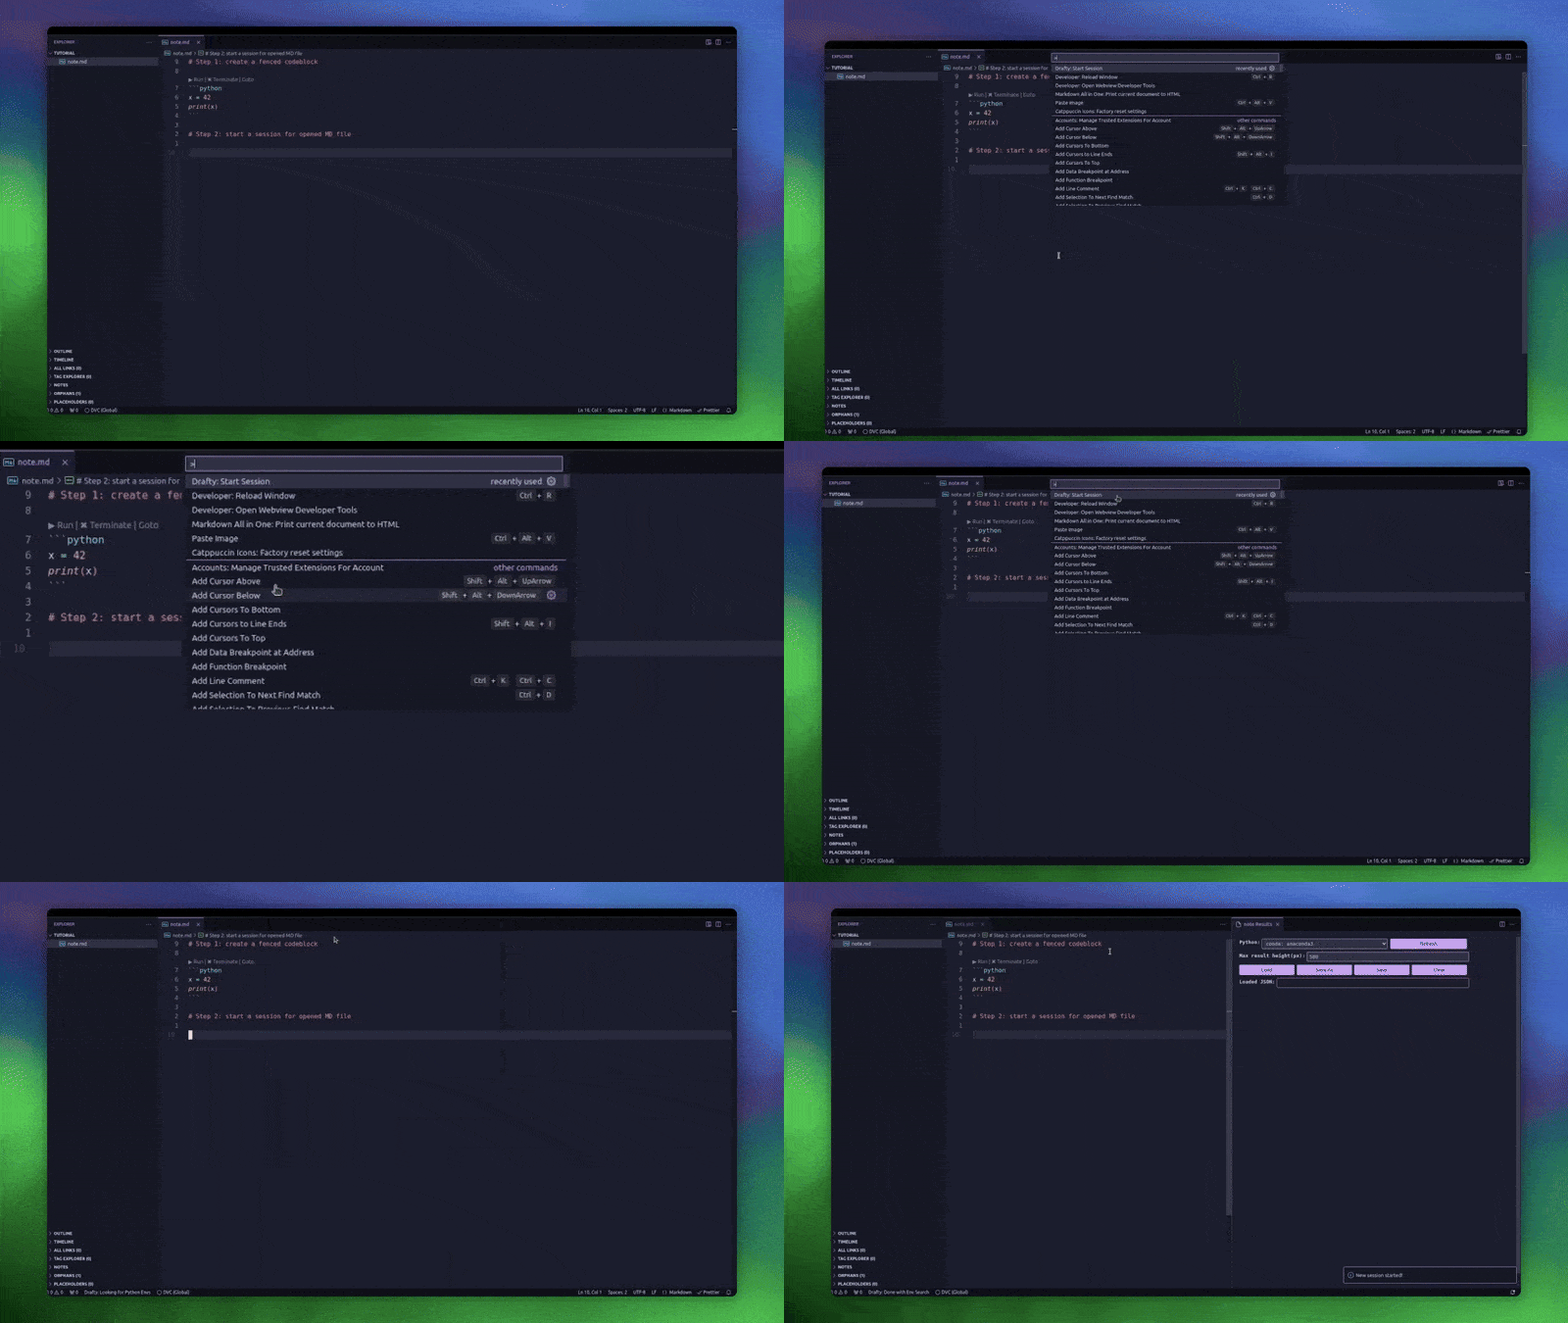
Start a session
Just like Jupyter notebook, you can start a separate kernel for each opened MD file. To do so, simply
- Open the Command Palette (Ctrl+Shift+P / Cmd+Shift+P)
- Type "Drafty: Start Session"
- Select your preferred Python environment in opened panel
Note: you will need to have IPython installed in your environment, which is default in normal conda env.
-
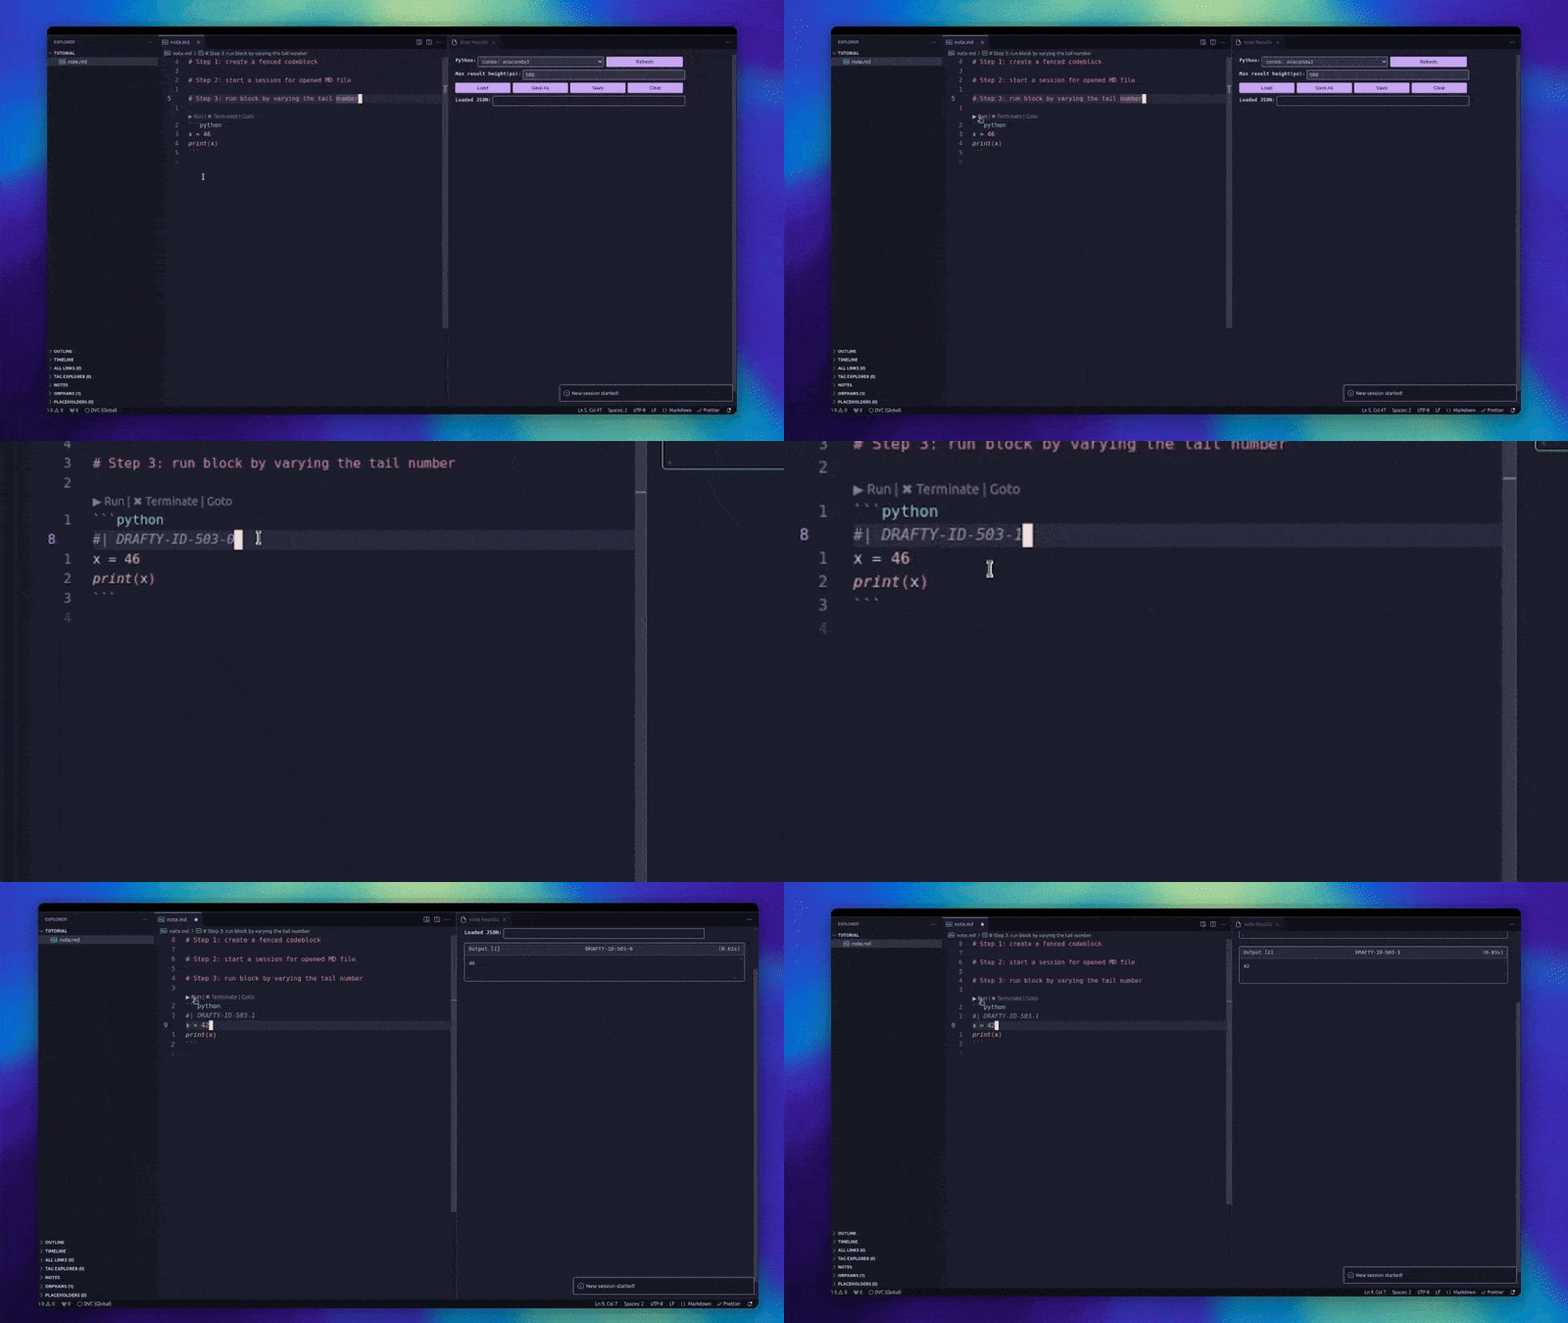
Run Your Code by Varying the tail number
When clicking
Run, Drafty will- create a
DRAFTY-IDfor the block, which has a 3-digit belly number and a 1-digit tail number. - You can change the tail number will render different results(snapshots) of the same codeblock.
This is useful when you have tinker-check cycles in your workflow.
- create a
-
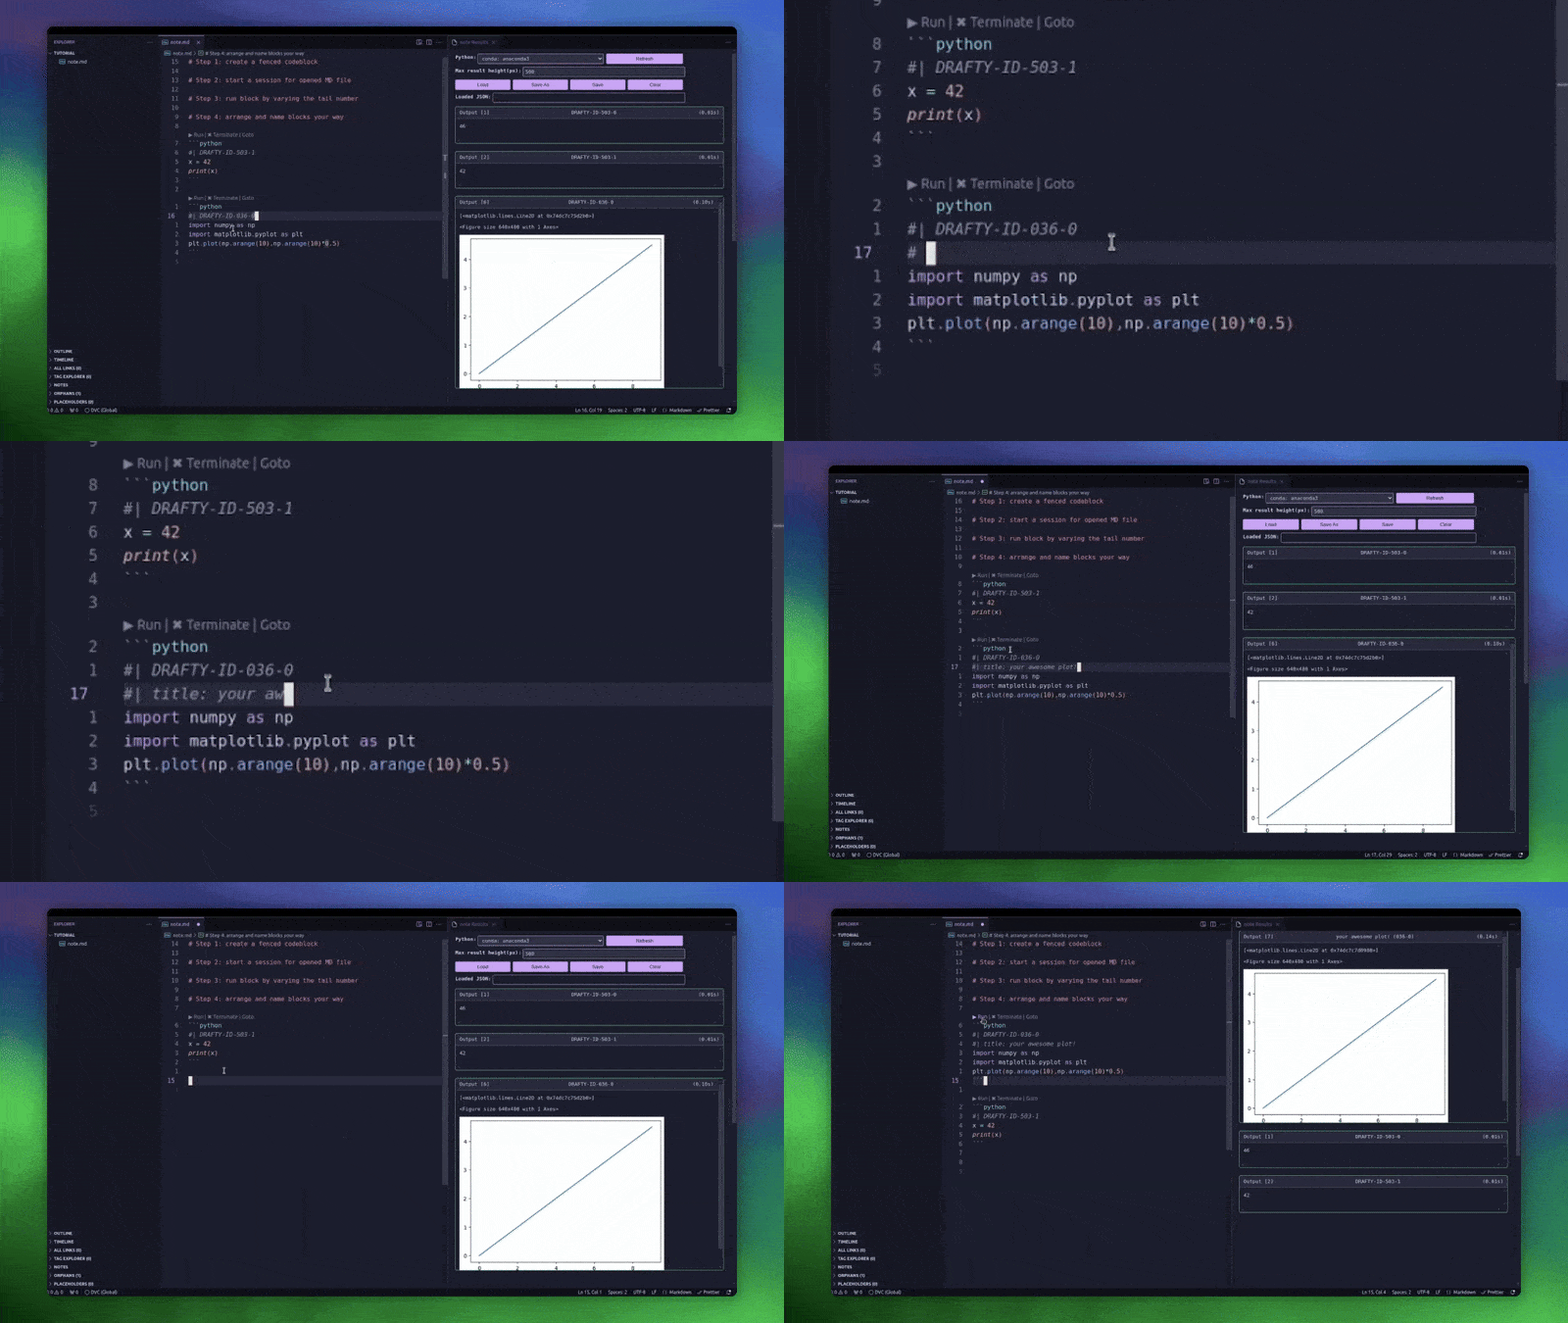
Name and rearrange result snapshots
- We provide special directive
#| title: xxxxto name a render snapshot to make it easier to find - You can rearrange codeblocks and their result snapshots will be shuffled to reflect updated codeblock order
- We provide special directive
-
Render Interactive Plot through Directives
Unlike Jupyter notebook, Drafty employs
plotly.jsto render interactive scatter/curve/surface plots. Through#|directives, user can easily- create slider or input controls
- specify plot type and "onUpdate" commands (more details in Sec. Special Directives)
-
Save Your Results
- Click the "Save"/"Save as" button in the results panel to store outputs
- Use "Load Results" to restore previous session states
More examples can be found in test/examples/notes.
We provide special directives(lines starting with #|) to create interactive plots. Per ChatGPT, 3 syntax rules for writing directives are:
- Start every directive with
#|followed by a keyword (likeslider,input, orcurve) and a colon. - After the colon, list parameters separated by commas—for example, a basic slider is written as
#| slider: param_name, min, max, step. - To add multiple items in one line, group shared settings in square brackets (e.g.,
[param1, param2]) or separate different settings with semicolons (e.g.,#| slider: param1, 0, 5, 0.1; param2, 5, 15, 0.1).
For a detailed explanation, we have implemented the following interactive elements:
-
Sliders
- single slider control,
#| slider: param_name, min_val, max_val, step("step" is optional) - multiple sliders sharing one range,
#| slider: [param_1, param_2], min_val, max_val, step - sliders of different ranges,
#| slider: param_1, min, max, step; param_2, min, max, step
- single slider control,
-
Inputs
- single number input,
#| input: param_name, default_num - number inputs sharing one default,
#| input: [param_1, param_2], default - inputs with different defaults,
#| input: param_1, default_1; param_2, default_2 - single dropdown menu,
#| input: param_name, ["opt1","opt2"] - multiple dropdown menus,
#| input: param_1, ["opt1","opt2"]; param_2, ["opt3", "opt4"]
- single number input,
-
Plots
- Dynamic plots(that should be updated when tinkering sliders/inputs)
- single curve plot,
#| curve: y_name=some_func(x,...)("..." indicates other arguments) - multiple curves,
#| curve: y1=func_1(x1,...); y2 = func_2(x2,...) - single scatter/surface plot,
#| scatter/surface: z=some_func(x,y,...) - multiple scatter groups,
#| scatter: z1=func1(x1,y1,...); z2=func2(x2,y2,...)
- single curve plot,
- Static plots(that should not be updated, usually served as references)
- single x-y curve:
#| curve: [x_name,y_name] - multiple x-y curves:
#| curve: [x_1, y_1]; [x_2, y_2] - single scatter/surface:
#| scatter/surface: [x_1, y_1, z_1] - multiple scatter groups/surfaces:
#| scatter/surface: [x_1, y_1, z_1]; [x_2, y_2, z_2]
- single x-y curve:
- Dynamic plots(that should be updated when tinkering sliders/inputs)
drafty.defaultPath: Default path used when saving results JSON with the 'Save' button, default value is pwd.drafty.removeOrphanedBlocks: Whether remove result blocks from the panel when its ID has no matched belly number in MD doc, default is false.drafty.savingRule: If set tolatest-only, old JSON result files are removed before saving new JSON file. Otherwise keep all saved files(keep-all).
