Pronto! Predicted was built to help Seattle's cycle sharing program better reshuffle there bicycles. They have been having a difficult time and after hearing they do not use predictive analytics from an employee, I set out to make the single dispatcher's life a little easier using the power of data science!
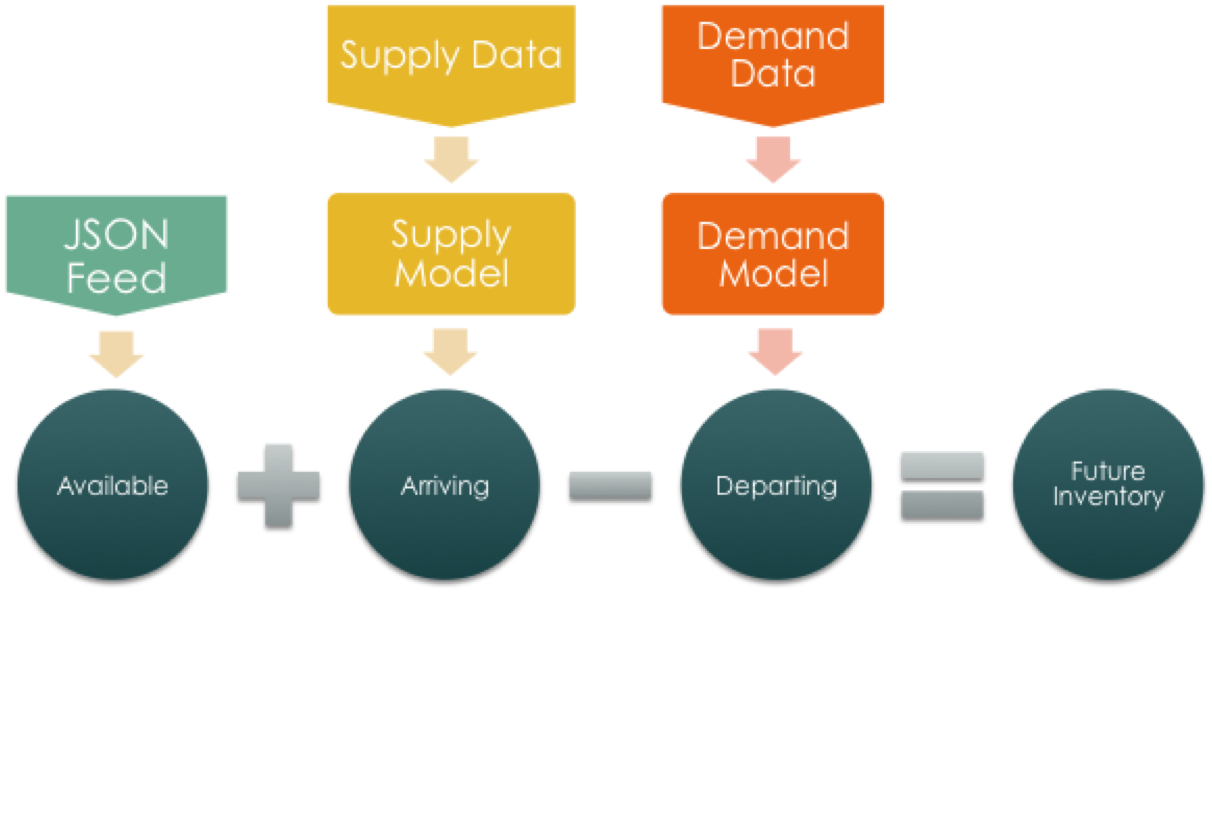
Let's see how the application works. Using Pronto's JSON feed to get the number of available bikes at each station and scraping hourly weather forecasts, Pronto! Predicted is already prepared to predict the future as soon as it loads.
When you arrive on the website, you will have the option to look four time periods ahead. Then click "Go!".
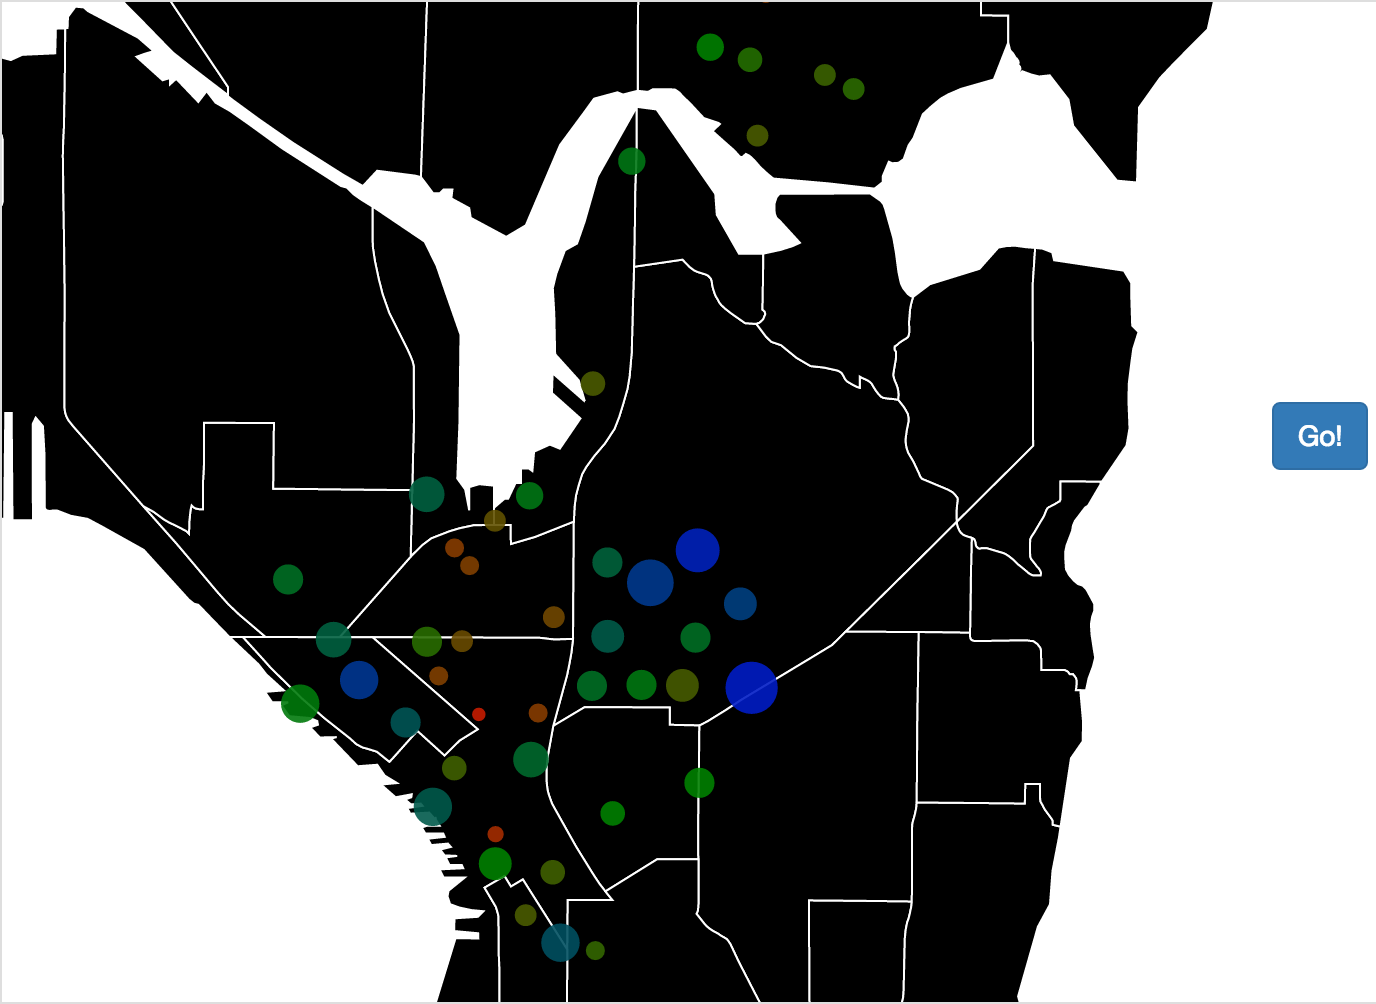
After you click "Go!" the circles will shift according to there predicted size.
The circles represent a unique station and the sizes of the circles represent the number of bikes currently docked at a station. They are comparable across all stations, no matter the number of docks at a station. On the other hand, the colors represent how full each station is relative to the number of viable available docks. The colors mean as follows:
- Blue: Full
- Green: 50% full
- Red: empty
The color scale slides between the colors, so use blended colors to indicate between the three states above. At anytime, hover on a circle to get the station ID and predicted count.
I started with the data from Pronto's data competition. They provide 1-year of trips and meta information about each station.
| date-time | Starting Station | Ending Station |
|---|---|---|
| 1/12/2015 8:00:00 | CH-04 | BS-01 |
| 1/12/2015 11:00:00 | PS-02 | SLU-03 |
I then transformed the data with the following steps in order to create a dataset for supply * a data set for demand:
- Scrub data
- Groupby by date, hour, ending station (supply) or starting station (demand)
- Impute date-times for every station with zero rentals
- Bin hours to balance classes
- Create & Download Features:
- Create lagged variables
- Hourly weather data (NOAA)
- Elevations (Google API)
- Remove outliers
note
I did not try to determine when rides were intended to enter or leave from a full or empty station. There is another data set, which I could use to help. Getting user ID's for each trip would be very useful for this problem a well.
I then train my models using the data sets that I created. First, I use a binary classfier to classify if a ride occured, then pipe all the predicted rides over to a 4 way classifier, which is trained on the subset of the data with positive rides. The following images outline the models:
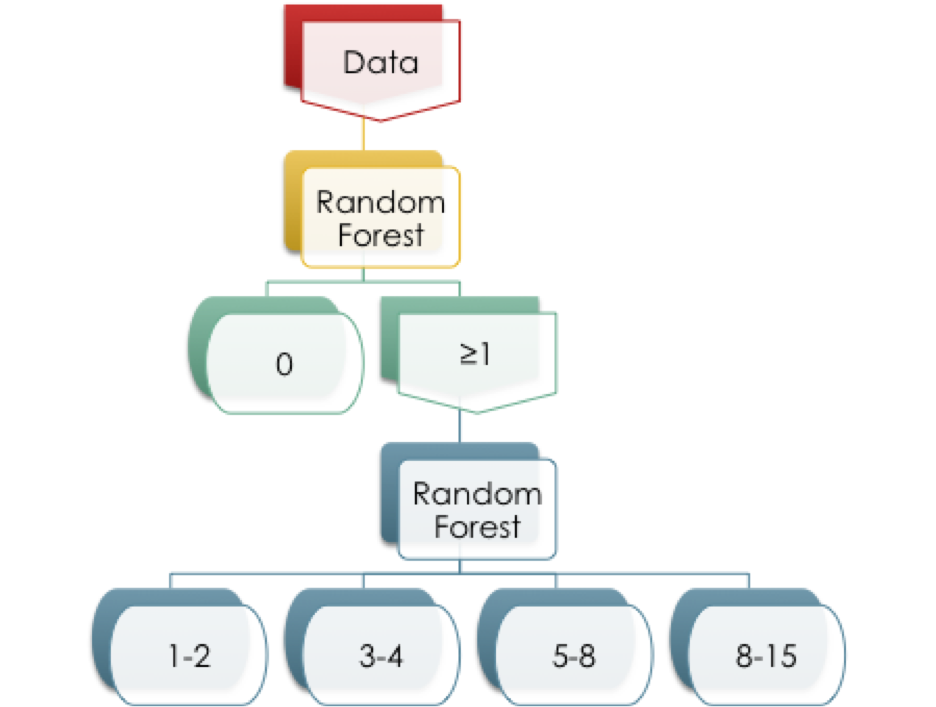
- The binary classifiers had AUC's of approximately 0.85.
- The 4-way classifiers had accuracies of approximately 62%