Create a report with very few lines of python code.
Example
from report import report
import seaborn as sns
import matplotlib.pyplot as plt
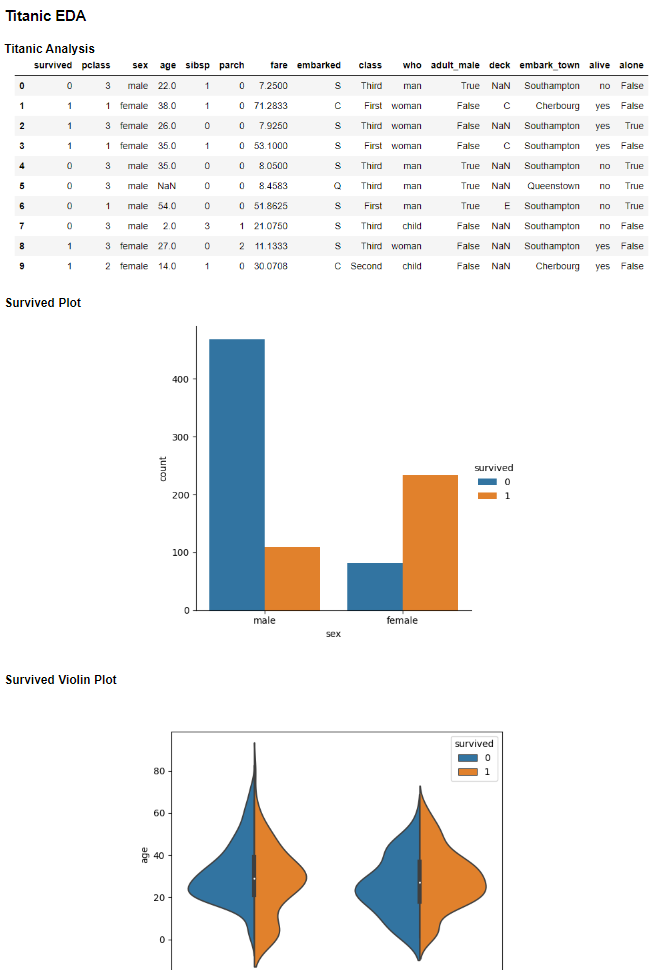
#Get Titanic Dataset
df = sns.load_dataset('titanic')

fig = sns.catplot(x ="sex", hue ="survived",kind ="count", data = df)
plt.savefig('data/Survived.png')

sns.violinplot(x ="sex", y ="age", hue ="survived",data = df, split = True)
plt.savefig('data/Survived_violinplot.png')
#build Report
titanic_report = report.Report()
titanic_report.header("Titanic EDA")

titanic_report.subheader("Titanic Analysis")
titanic_report.dataframe_image(df.head(10))

titanic_report.subheader('Survived Plot')
titanic_report.image('data/Survived.png')

titanic_report.subheader('Survived  Violin Plot')
titanic_report.image('data/Survived_violinplot.png')

#show report
titanic_report.show()