Start gwas.sif container, generate synthetic phenotype with 100 causal genetic variants, and run plink2 to compute GWAS p-values.
This is a demo using synthetic genotypes (10K subjects, 150K SNPs), produced by HapGen2 tool.
singularity shell --no-home -B $COMORMENT_REF:/ref -B data:/data gwas.sif
simu_linux --bfile /ref/hapgen/chr21 --qt --causal-n 100 --out /data/simu
plink2 --bfile /ref/hapgen/chr21 --glm allow-no-covars --pheno /data/simu.pheno --pheno-name trait1 --out /data/plink
Start python3.sif container, and generate QQ plot and Manhattan plots.
singularity shell --no-home -B $COMORMENT_REF:/ref -B data:/data python3.sif
python /tools/python_convert/qq.py /data/plink.trait1.glm.linear --p P --snp ID  --out /data/plink.trait1.glm.linear.qq.png
python /tools/python_convert/manhattan.py /data/plink.trait1.glm.linear --p P --snp ID --bp POS --chr "#CHROM" --out /data/plink.trait1.glm.linear.manh
Use PRSice to compute polygenic risk scores on synthetic dataset.
Start gwas.sif container, and execute PRSice_linux tool:
singularity shell --no-home -B $COMORMENT_REF:/ref -B data:/data gwas.sif
/tools/prsice/PRSice_linux \
    --base /data/plink.trait1.glm.linear --stat BETA --beta --chr "#CHROM" --bp POS --snp ID --pvalue P \
    --target /ref/hapgen/chr21 \
    --pheno /data/simu.pheno --pheno-col trait1 \
    --fastscore --bar-levels 5e-08,1e-6,1e-5,1e-4,1e-3,0.01,0.05,0.1,0.5,1 \
    --out /data/trait1
Result in trait1.prsice file:
Pheno   Set     Threshold       R2      P       Coefficient     Standard.Error  Num_SNP
-       Base    5e-08   0.551604        0       110.673 0.997937        103
-       Base    1e-06   0.561591        0       148.262 1.31009 153
-       Base    1e-05   0.563446        0       182.494 1.60652 206
-       Base    0.0001  0.568096        0       237.958 2.07504 300
-       Base    0.001   0.584015        0       348.353 2.94029 505
-       Base    0.01    0.616787        0       623.339 4.91383 1108
-       Base    0.05    0.651179        0       1079.49 7.90152 2317
-       Base    0.1     0.666187        0       1458.03 10.322  3463
-       Base    0.5     0.688963        0       3103.9  20.8574 8735
-       Base    1       0.690659        0       4249.09 28.4397 12101
Start ldsc.sif container:
singularity shell --no-home -B $COMORMENT_REF:/ref -B data:/data ldsc.sif
Pre-process summary statistics with munge_sumstats.py script:
TBD: investigate why these commands were so slow...
python /tools/ldsc/munge_sumstats.py --merge-alleles /ref/ldsc/w_hm3.snplist --sumstats /ref/sumstats/PGC_BIP_2016.sumstats.gz --out /data/PGC_BIP_2016 --signed-sumstats Z,0
mv /data/PGC_BIP_2016.sumstats.gz /data/PGC_BIP_2016.sumstats && gzip /data/PGC_BIP_2016.sumstats   # hack-hack, ldsc produces .gz files which aren't actually compressed
python /tools/ldsc/munge_sumstats.py --merge-alleles /ref/ldsc/w_hm3.snplist --sumstats /ref/sumstats/PGC_SCZ_2014_EUR.sumstats.gz --out /data/PGC_SCZ_2014_EUR --signed-sumstats Z,0
mv /data/PGC_SCZ_2014_EUR.sumstats.gz /data/PGC_SCZ_2014_EUR.sumstats && gzip /data/PGC_SCZ_2014_EUR.sumstats
Calculate genetic correlation:
python /tools/ldsc/ldsc.py --rg /data/PGC_SCZ_2014_EUR.sumstats.gz,/data/PGC_BIP_2016.sumstats.gz \
--ref-ld-chr /ref/ldsc/eur_w_ld_chr/ \
--w-ld-chr /ref/ldsc/eur_w_ld_chr/ \
--out /data/ldsc_rg
Result:
Summary of Genetic Correlation Results
p1                              p2      rg      se        z            p  h2_obs  h2_obs_se  h2_int  h2_int_se  gcov_int  gcov_int_se
/data/PGC_SCZ_2014_EUR.sumstats.gz  /data/PGC_BIP_2016.sumstats.gz  0.6815  0.0211  32.2318  6.3311e-228  0.3476     0.0175  1.0201     0.0102     0.244       0.0085
singularity shell --no-home -B $COMORMENT_REF:/ref -B data:/data python3.sif
python /tools/python_convert/sumstats.py clump \
--sumstats /ref/sumstats/PGC_SCZ_2014_EUR.sumstats.gz \
--out /data/PGC_SCZ_2014_EUR.clump \
--bfile-chr /ref/1000genomes/[email protected]
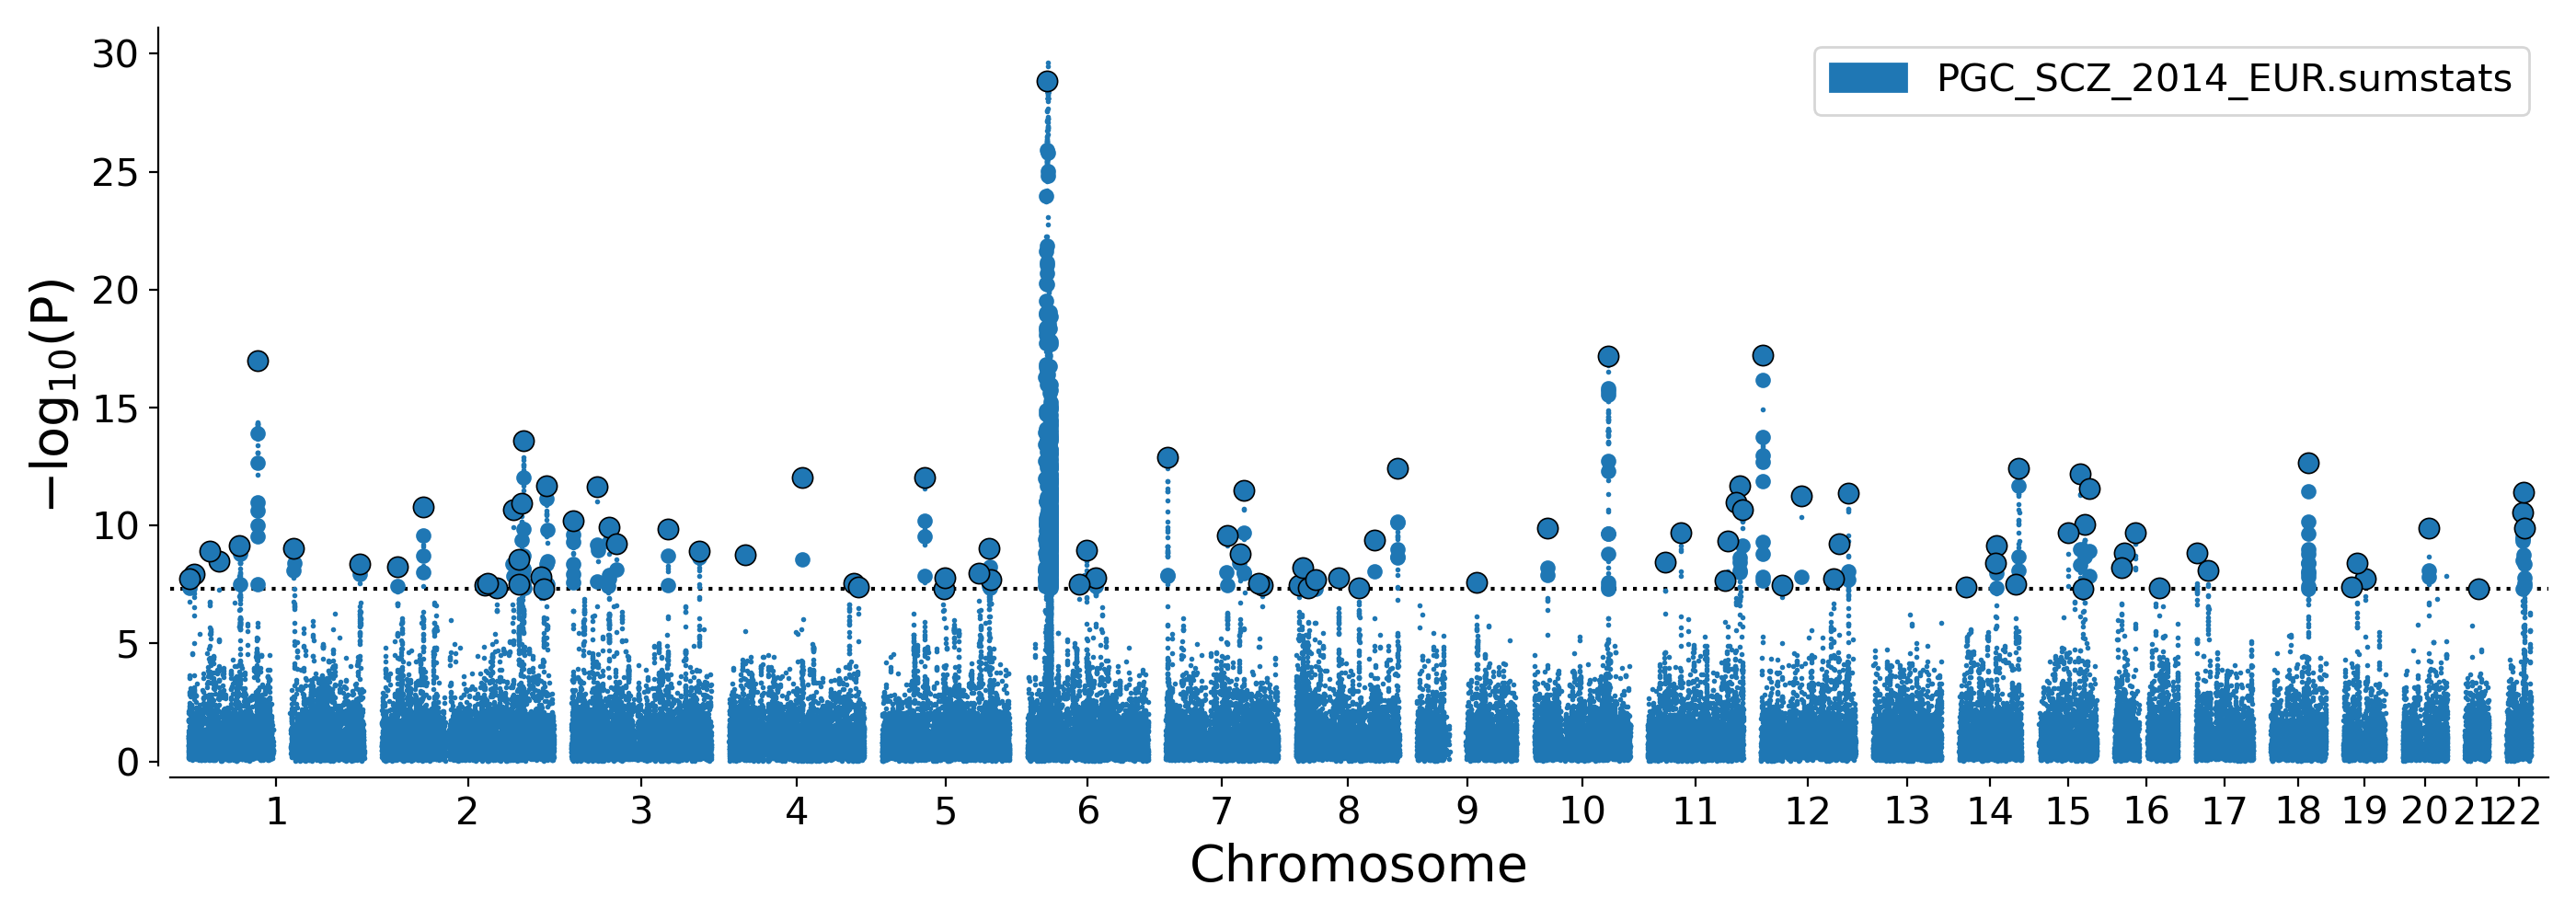
python /tools/python_convert/manhattan.py /ref/sumstats/PGC_SCZ_2014_EUR.sumstats.gz \
--lead /data/PGC_SCZ_2014_EUR.clump.lead.csv \
--indep /data/PGC_SCZ_2014_EUR.clump.indep.csv \
--out /data/PGC_SCZ_2014_EUR.manh
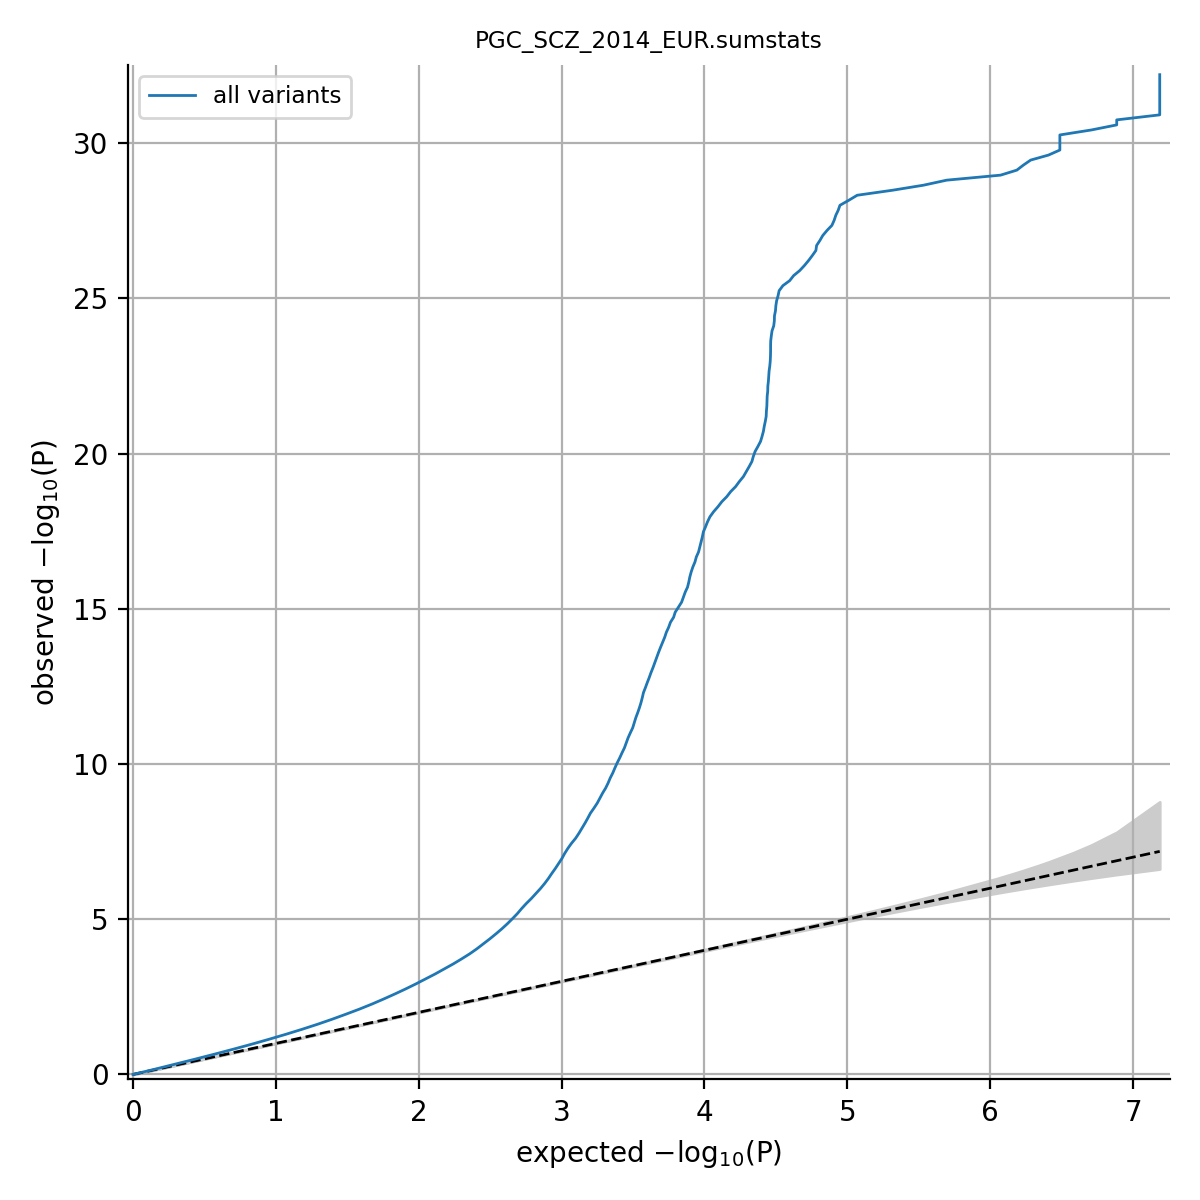
python /tools/python_convert/qq.py /ref/sumstats/PGC_SCZ_2014_EUR.sumstats.gz --out /data/PGC_SCZ_2014_EUR.qq.png
Result:
$head PGC_SCZ_2014_EUR.clump.loci.csv
locusnum	CHR	LEAD_SNP	LEAD_BP	MinBP	MaxBP	PVAL
1	1	rs4648845	2387101	2369498	2402499	1.737e-08
2	1	rs301797	8487323	8404093	8701288	1.202e-08
3	1	rs1498232	30433951	30412503	30437118	1.206e-09
4	1	rs11210892	44100084	44029353	44137257	3.417e-09
5	1	rs35998080	73278615	73275828	74033340	6.953e-10
...