Visualizing the consequences of Climate Change is the primary goal of this project. Here's what we're working towards. For more details, read the Executive Summary.
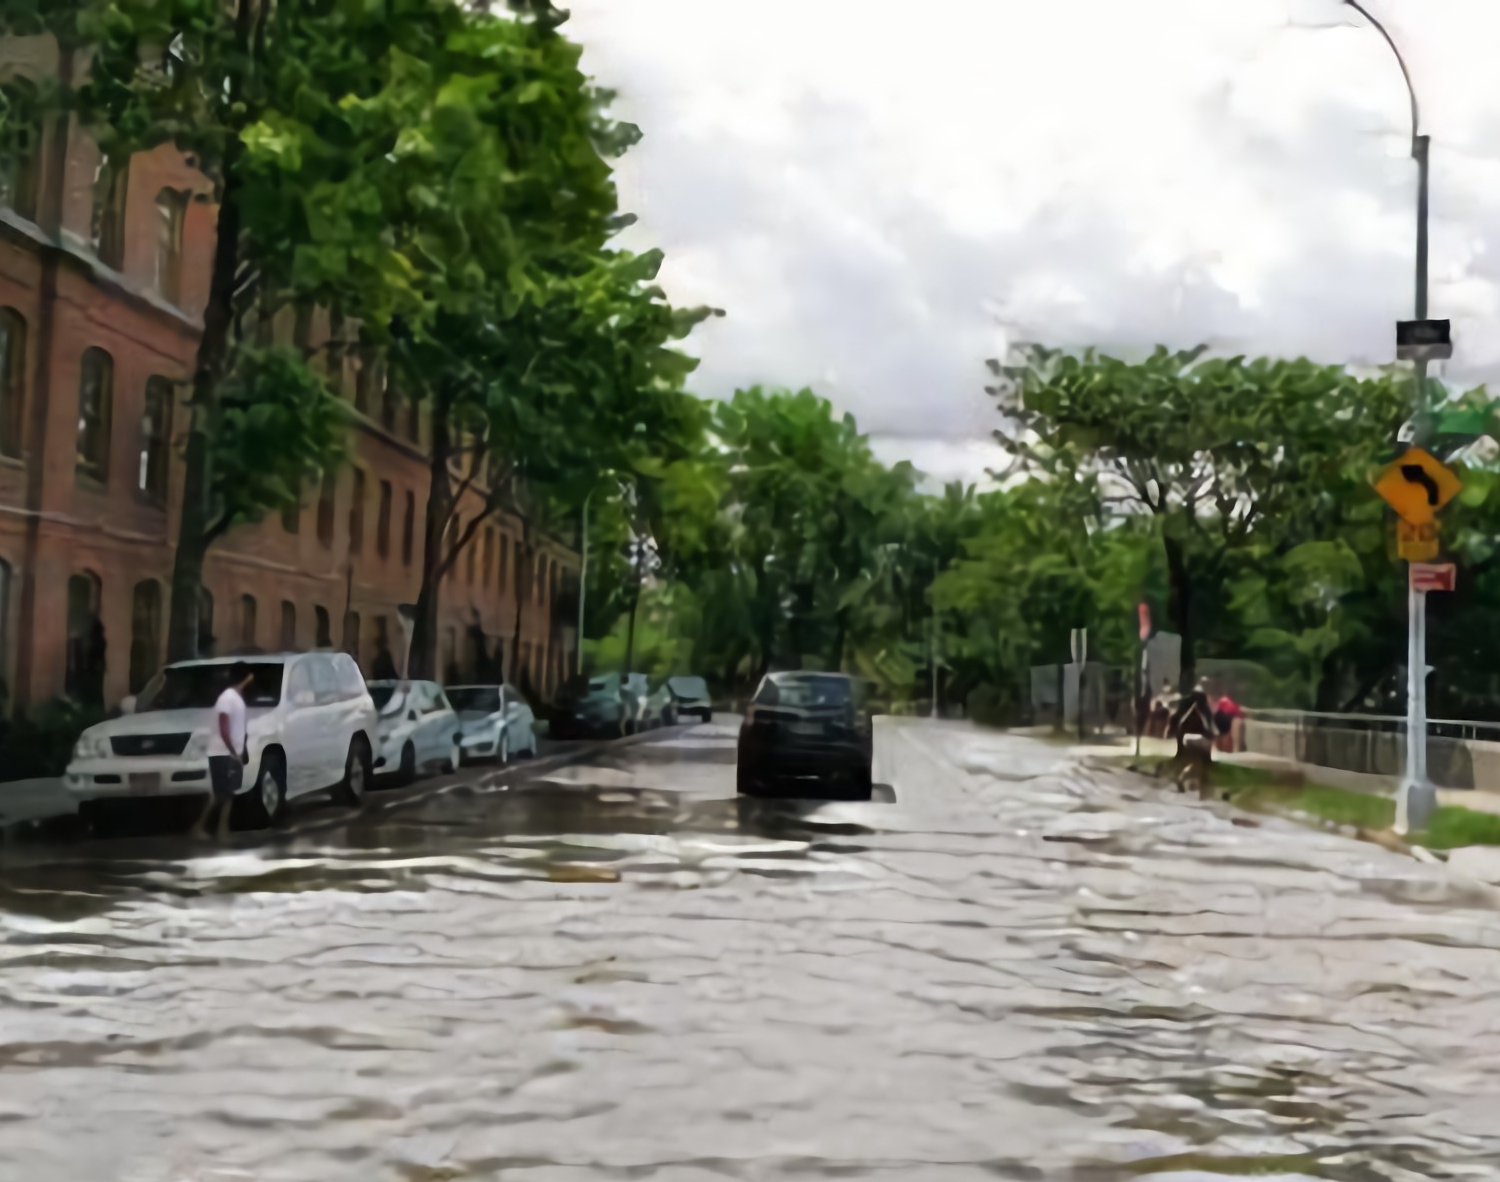
Goal: query an address, get image of potential event
Depending on whether or not there's a likelihood of increased flood risk, run a GAN model to illustrate how it would affect the place and nearby points of interest + user knobs to interact with the system and better understand
- the different global warming scenario
- the impact of various actions (individual or organizational)
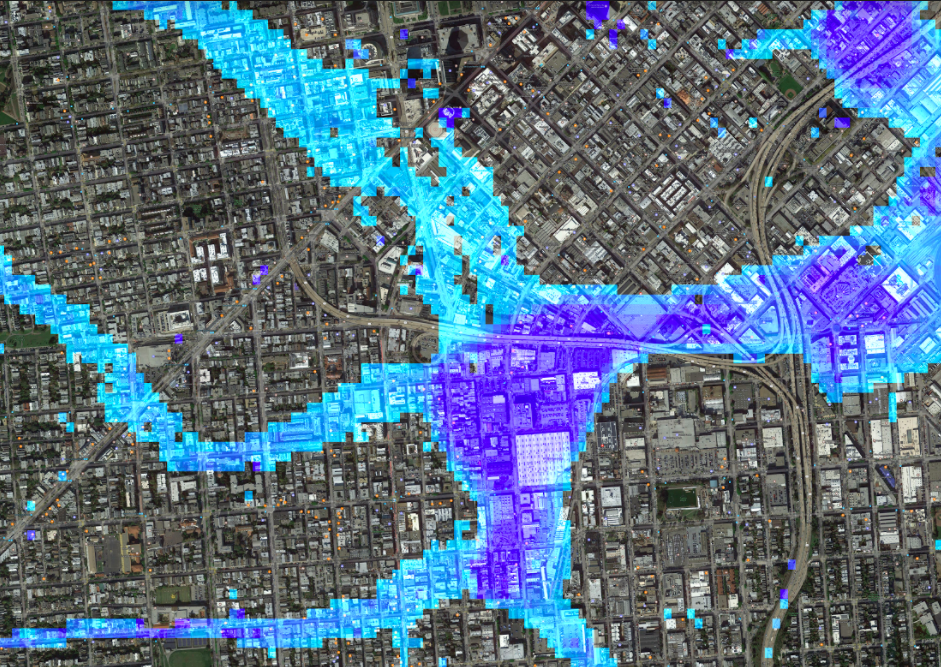
Google Maps overlay inspiration (Fathom)
Frequency of occurence for different return periods under the +1.5 scenario. Color map illustrate the new return period for a given location (for instance from ~ every 20 years to ~ every 15 years for green areas in the second plot)
Munit (Huang et. al) for VICC
- Augment the real dataset with paired images
- Pretrain the models ( + domain randomization)
- Enable totally different approach:
- height estimation
- ground-plane estimation


