Failure to Capture Common Sources of Variance in Data #57
Comments
|
Hi @whitleyo , P.S. Please upgrade to MOFA2 (https://github.com/bioFAM/MOFA2), it is a better software and we are no longer maintaining this repository. Also, feel free to join the Slack group where we can have a more interactive discussion. Best, |
Sign up for free
to join this conversation on GitHub.
Already have an account?
Sign in to comment
Hi,
I've tried MOFA with several datatypes, some having ~50 samples while others have 15 or 22 samples.
Here's an overview of the data:
RNA.vst = vst transformed RNA-seq data
DNAm = DNAm m-values
metab_annot_extract = metabolites, cell extract, annotated
metab_annot_secreted = metabolites, cell secretion, annotated
metab_unannot_extract = metabolites, cell extract, unannotated
crispr_qBF = quantile normalized Bayes Factors from CRISPR screens similar to that in Hart et al. 2015, but using a smaller library.
I ran MOFA with the following training options on this data (20 other models were run, most producing similar results, none having a common axis of variation shared between all datatypes)
The resulting model has the following explained variance:
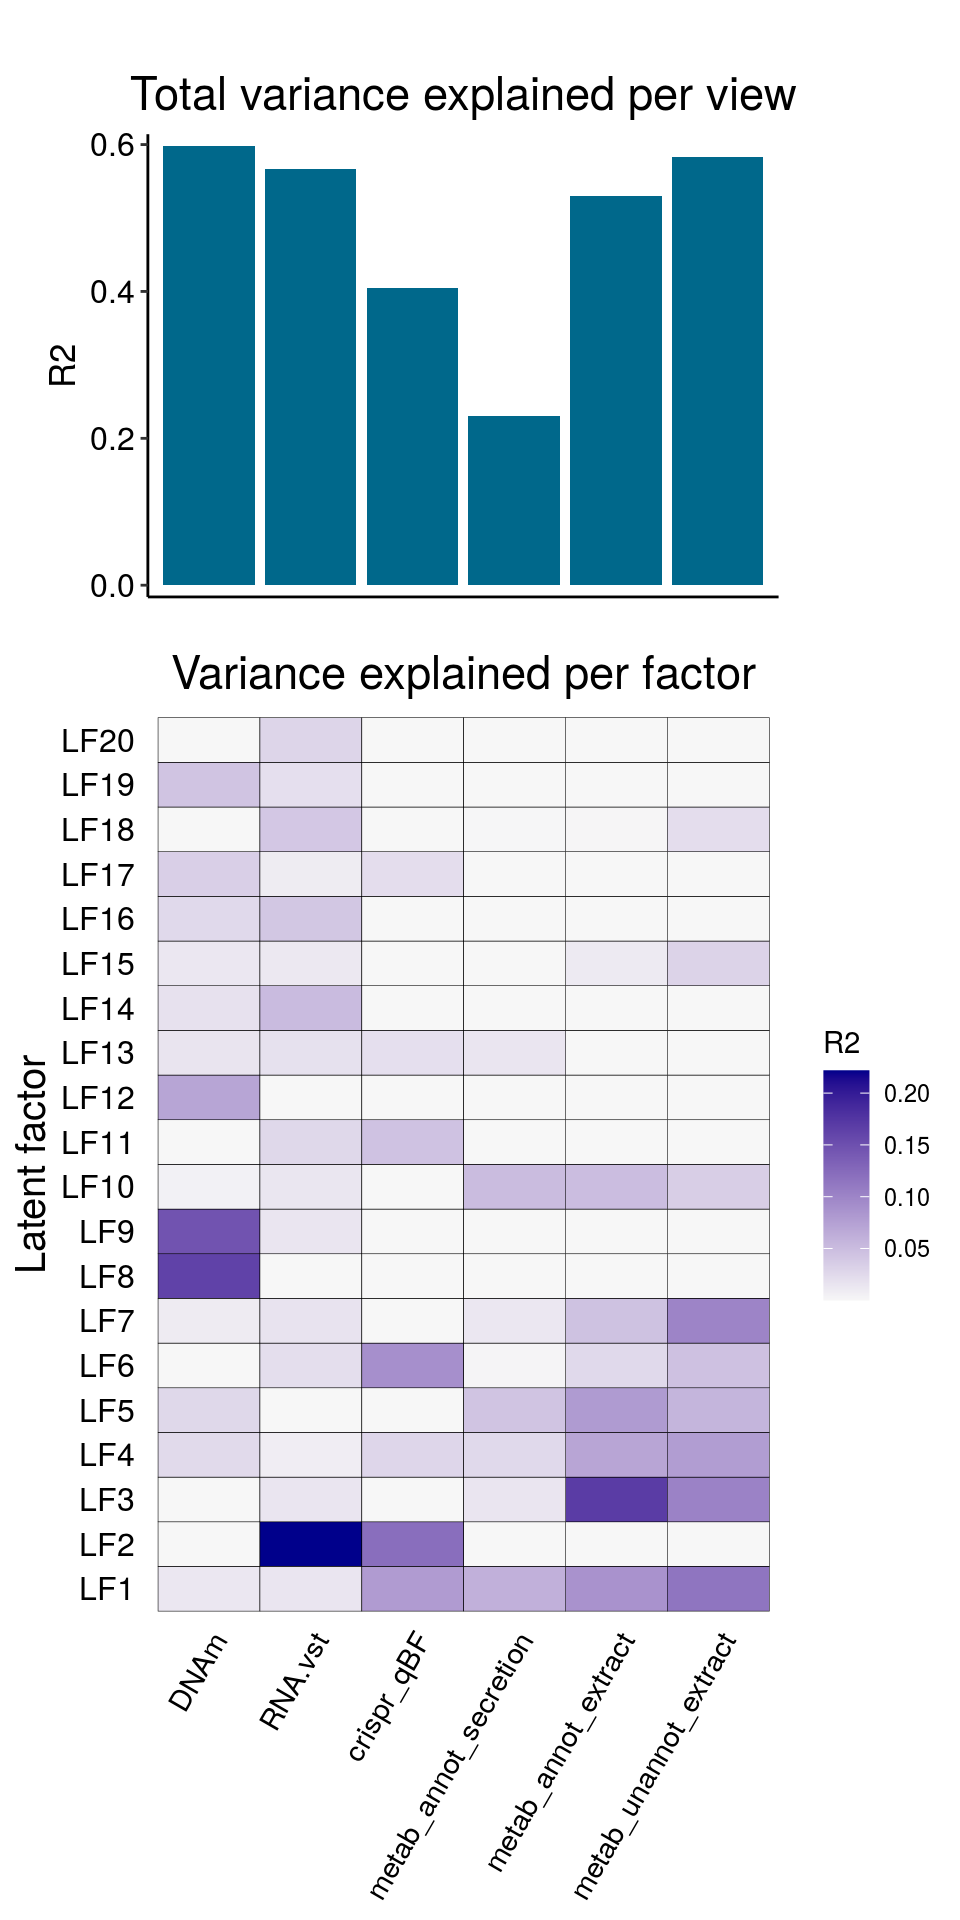
and correlattion between factors:
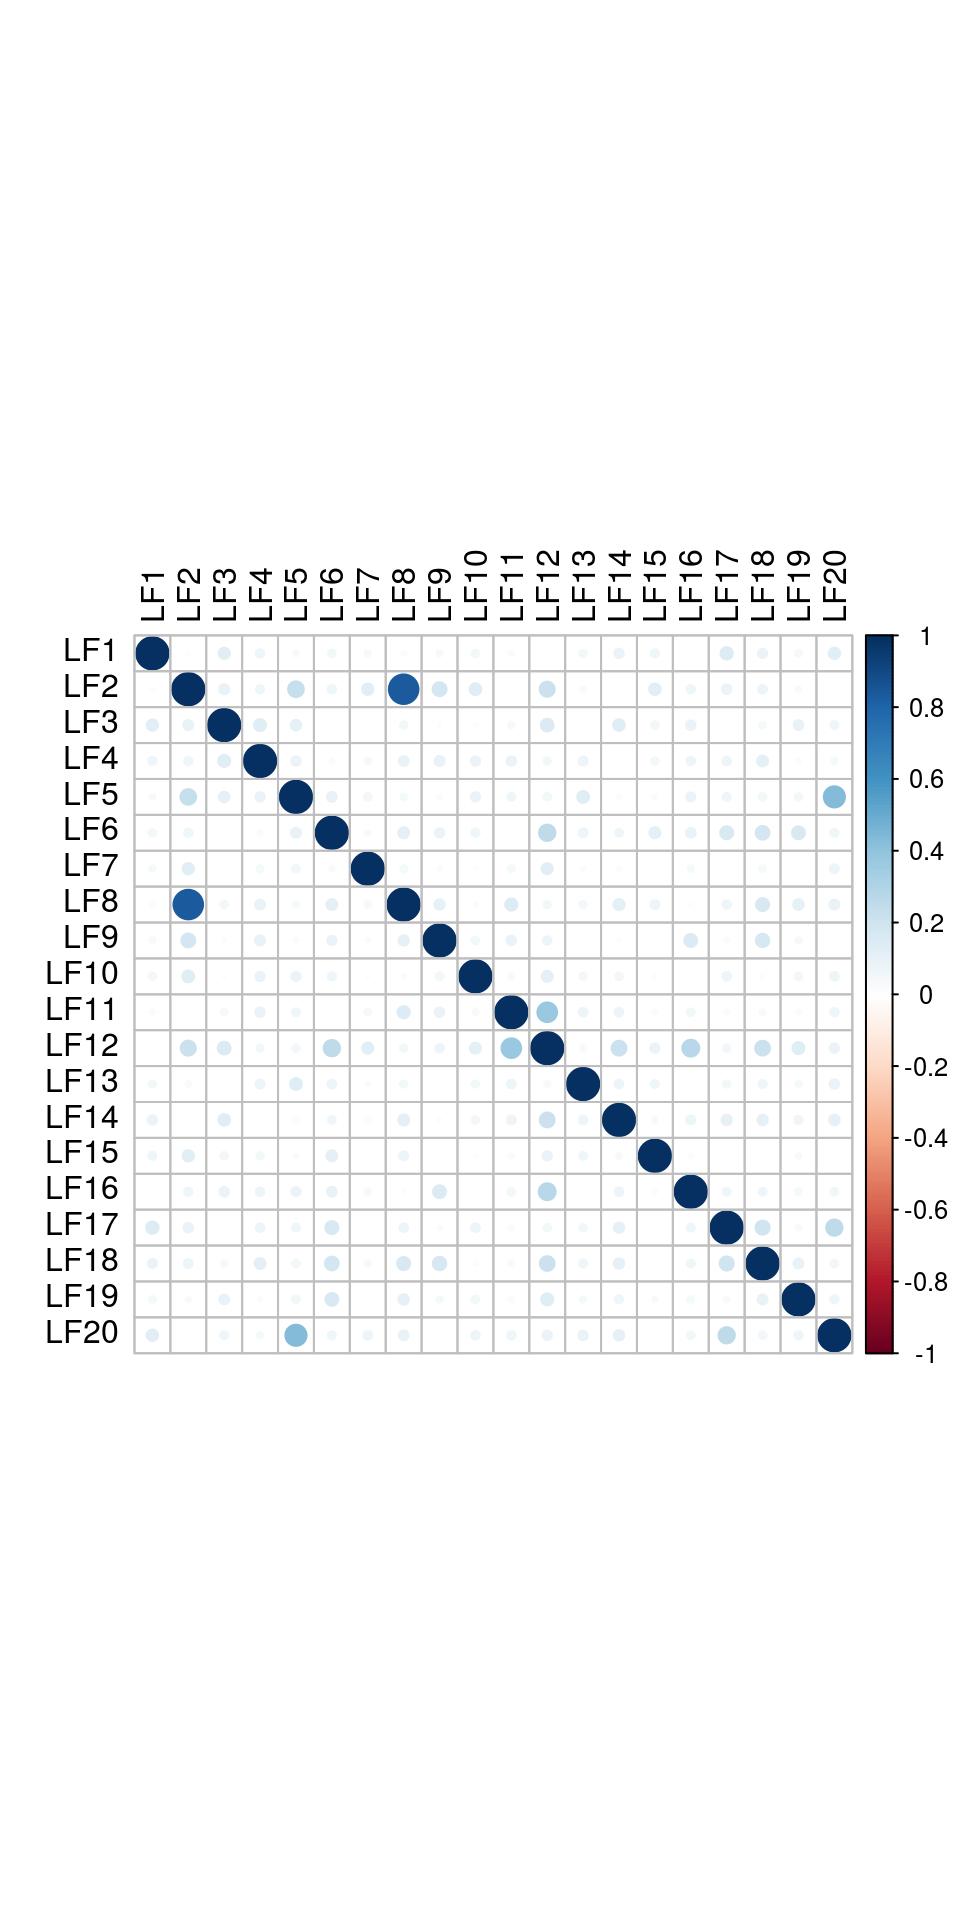
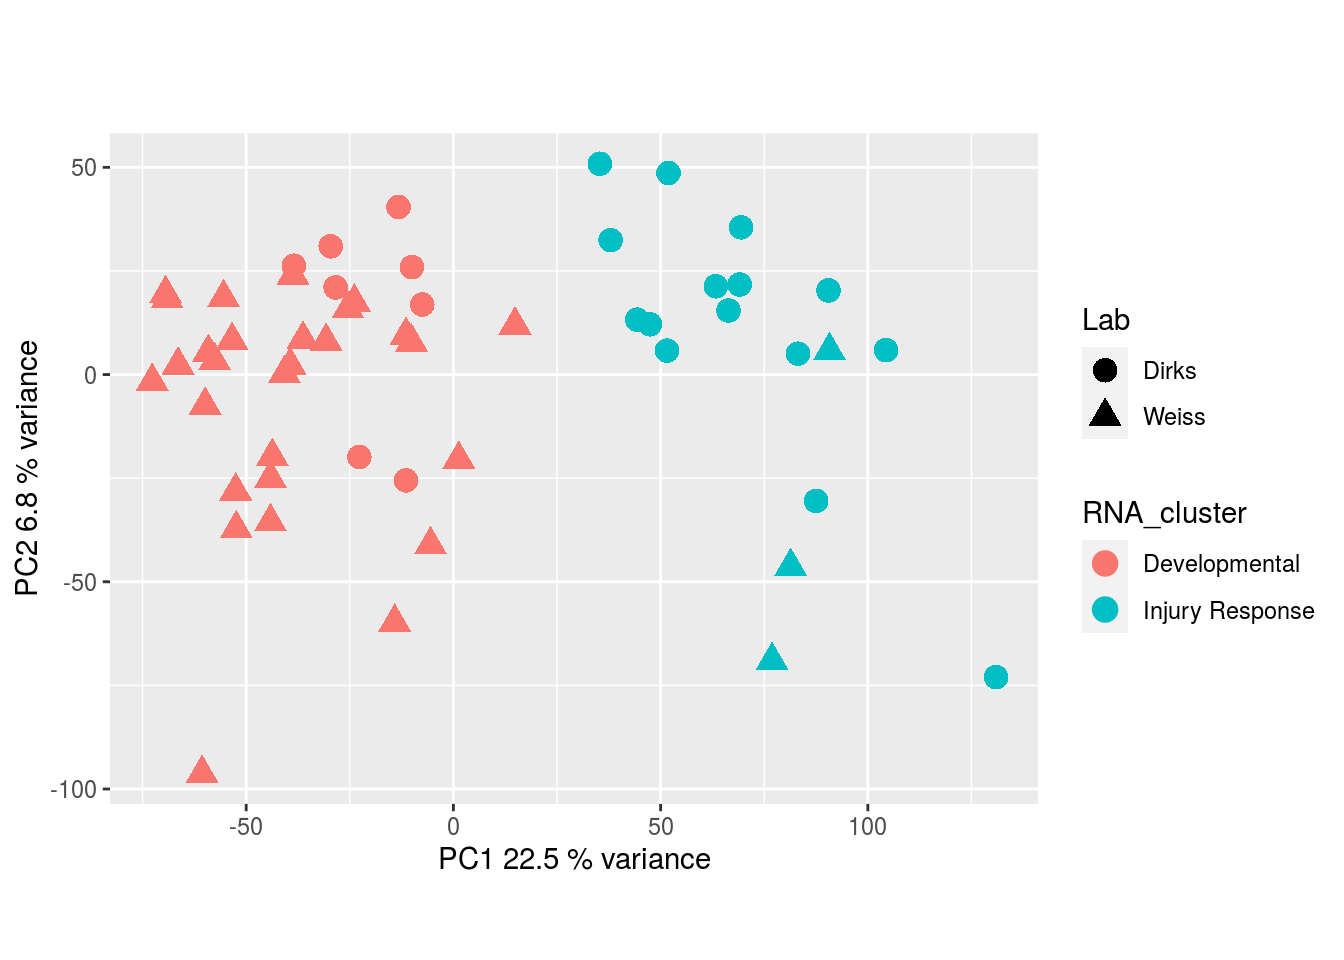
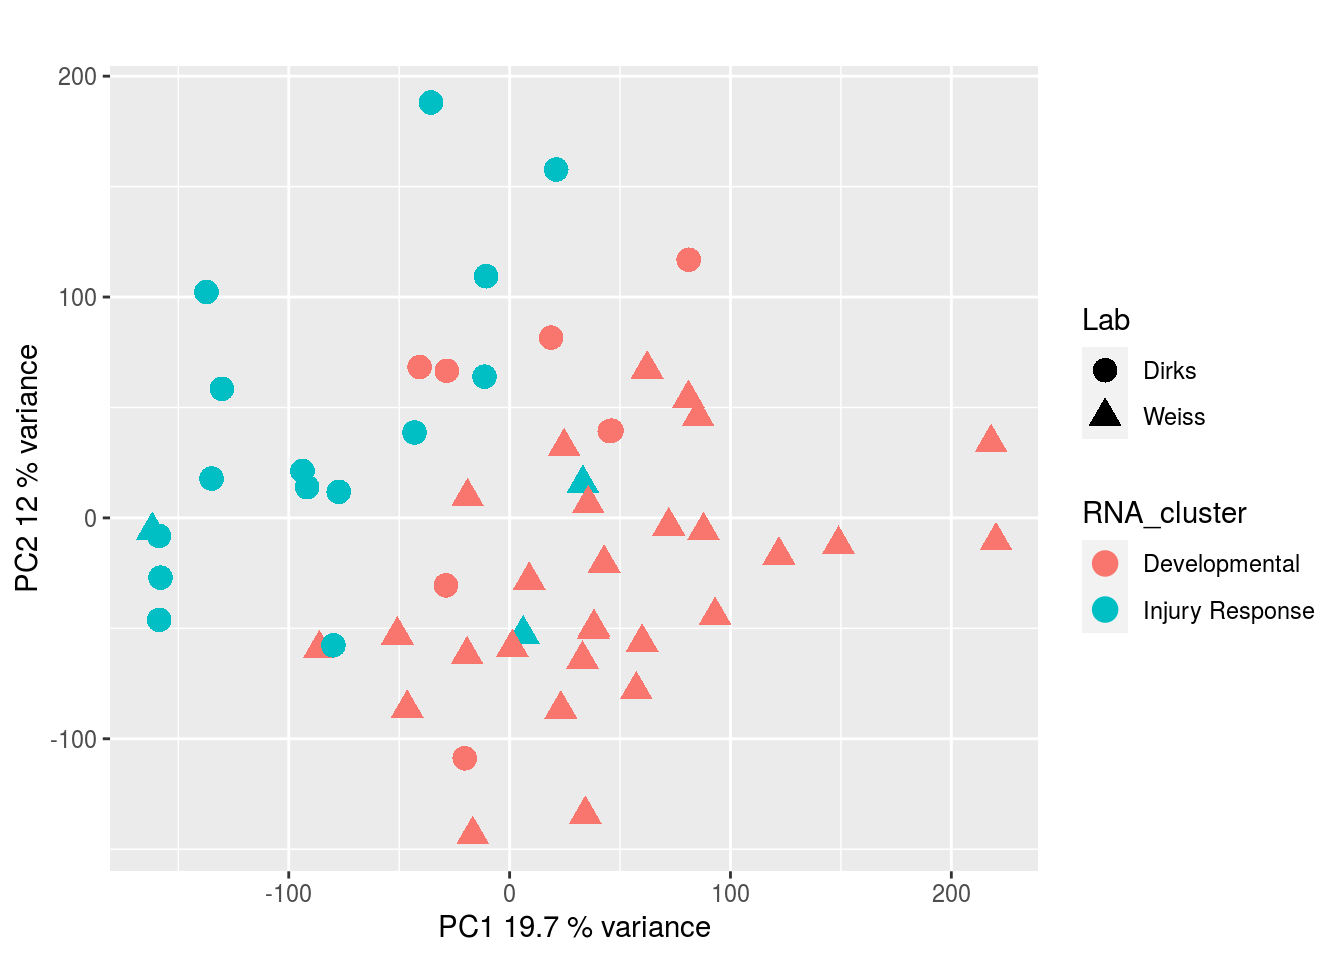
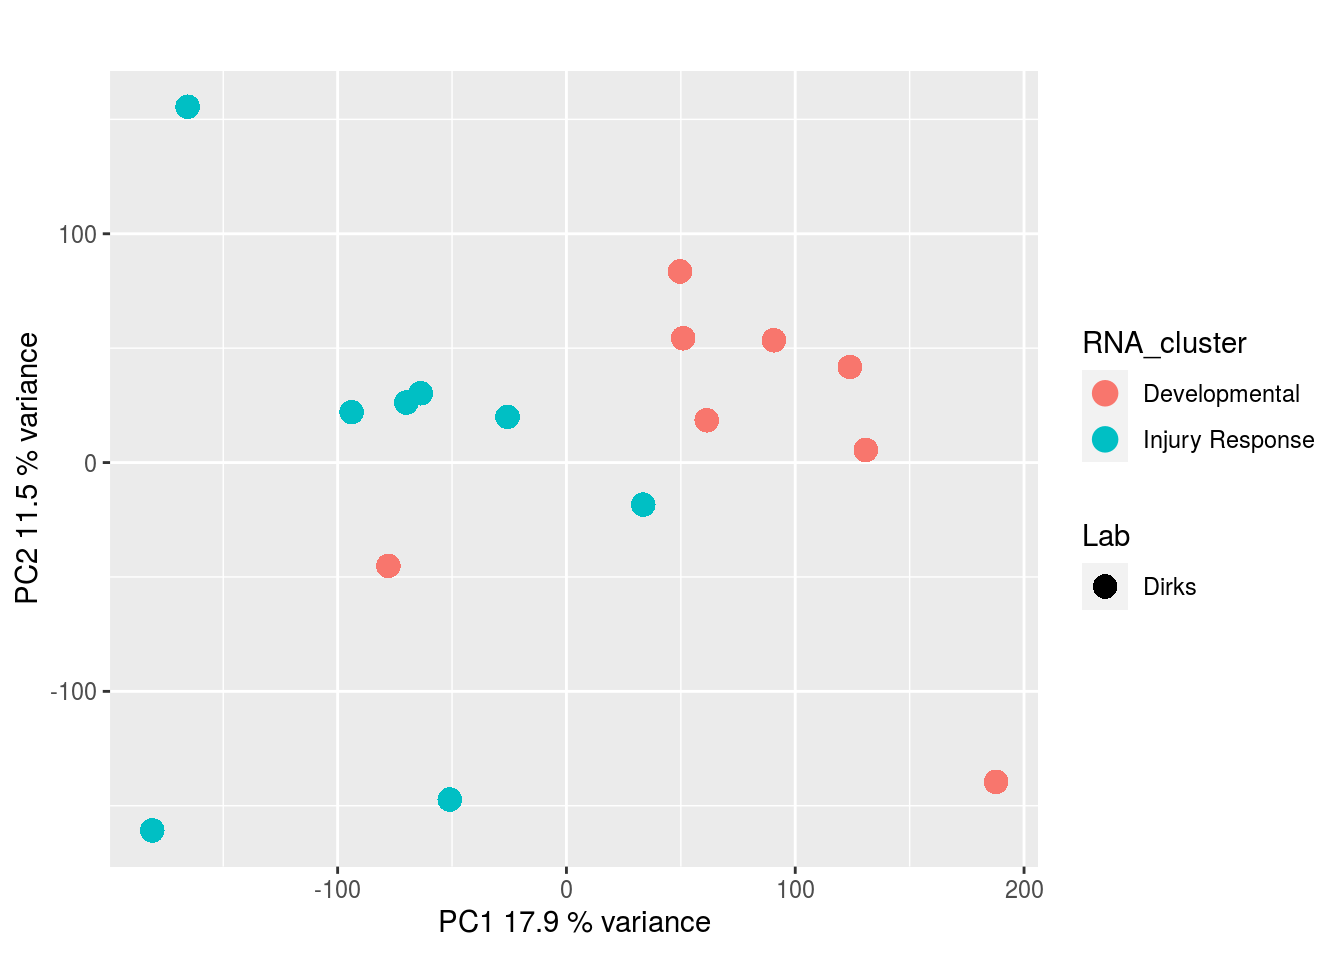
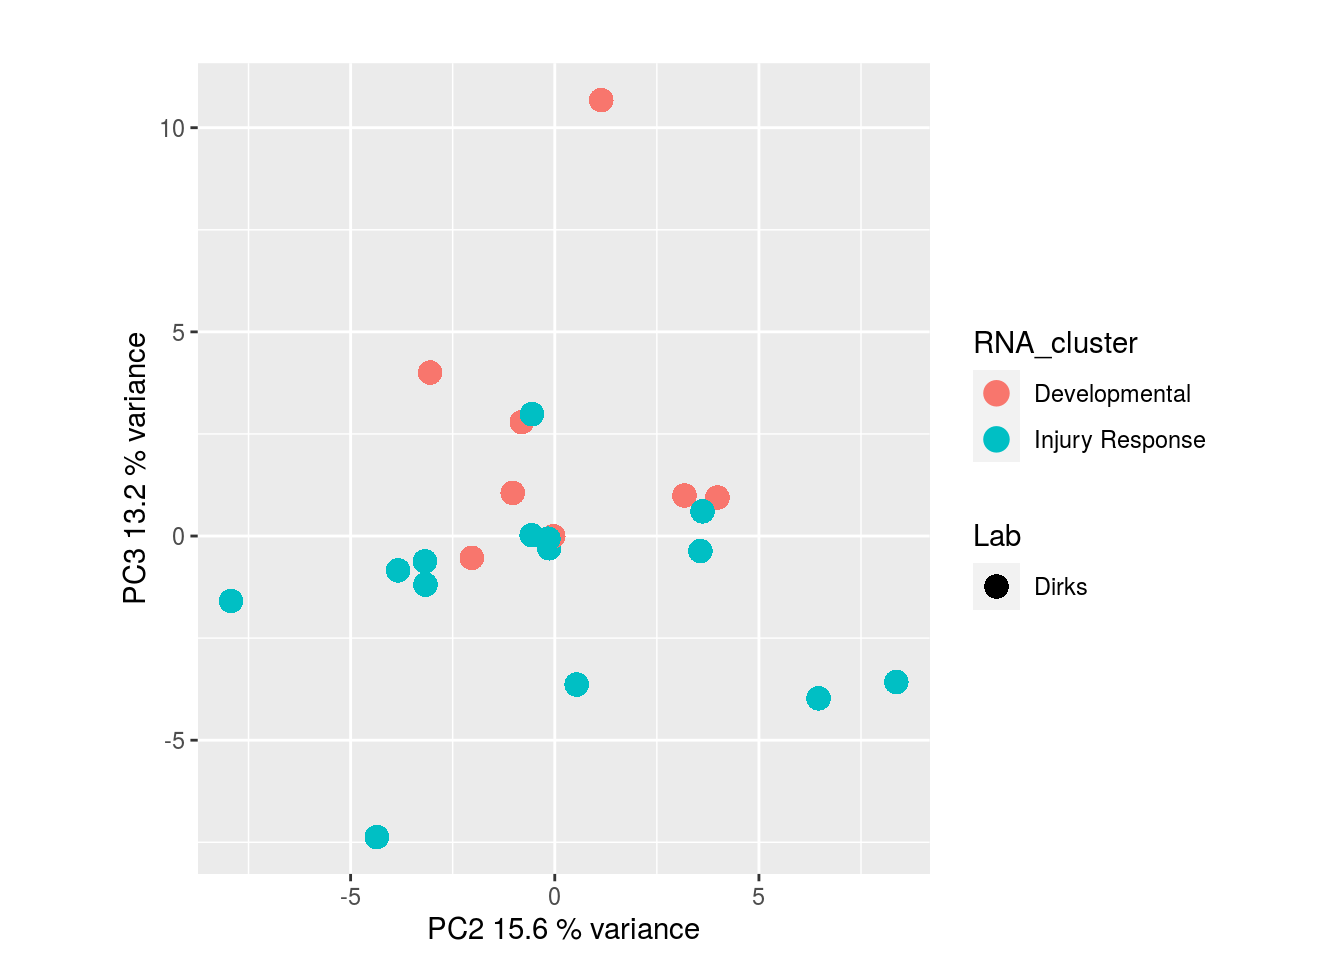
The results would seem to imply that metabolomics data do not share a common axis with the RNA-seq and DNA methylation data. When I run PCA on eahc of the data matrices as input to MOFA individually however, I get clean or relatively clean separation of clusters identified in RNA-seq data in each datatype:
RNA-seq:
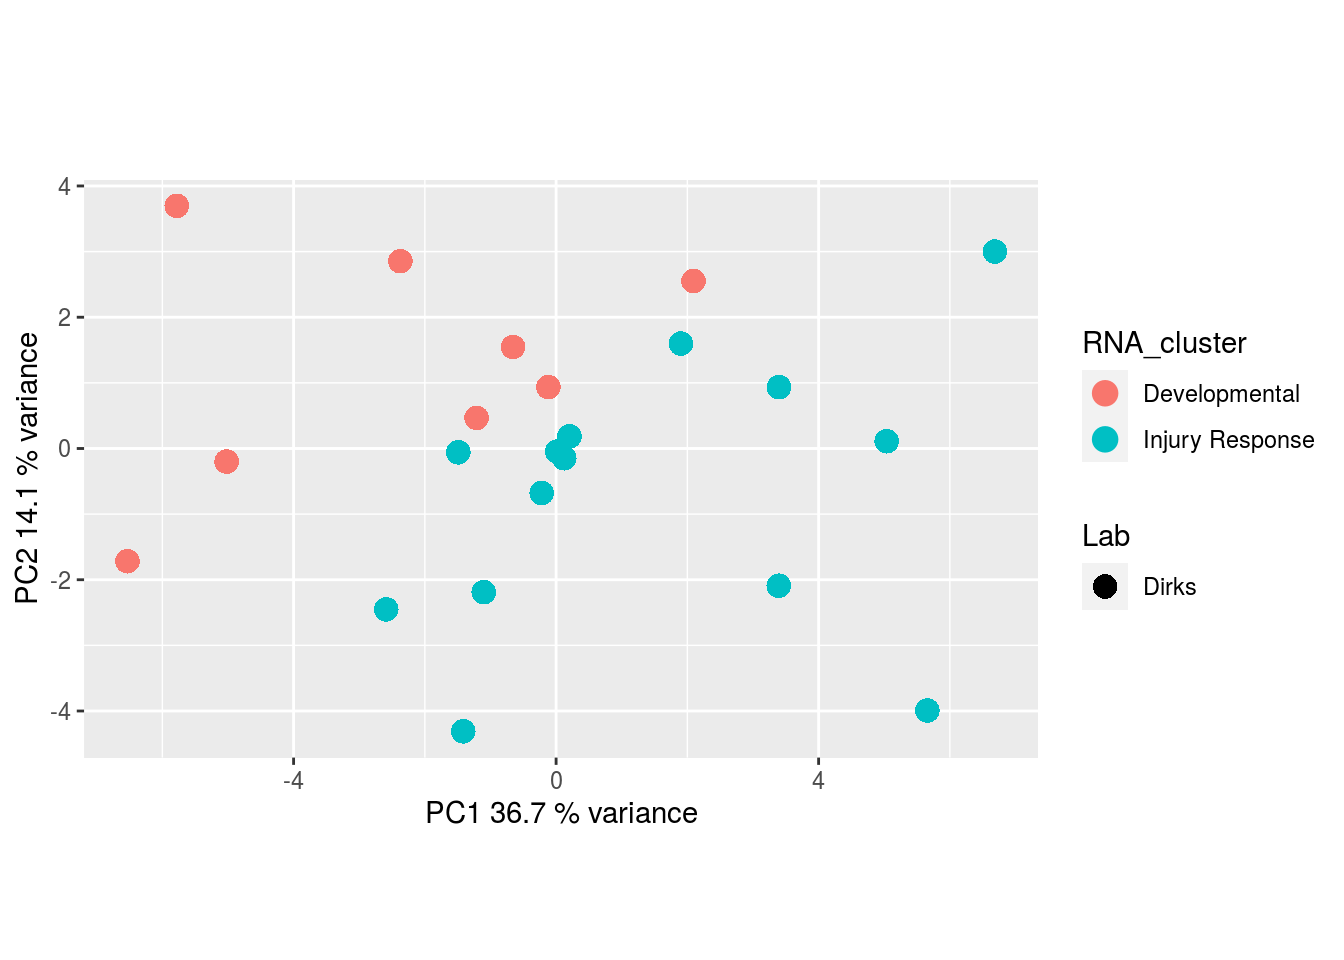
DNA methylation:
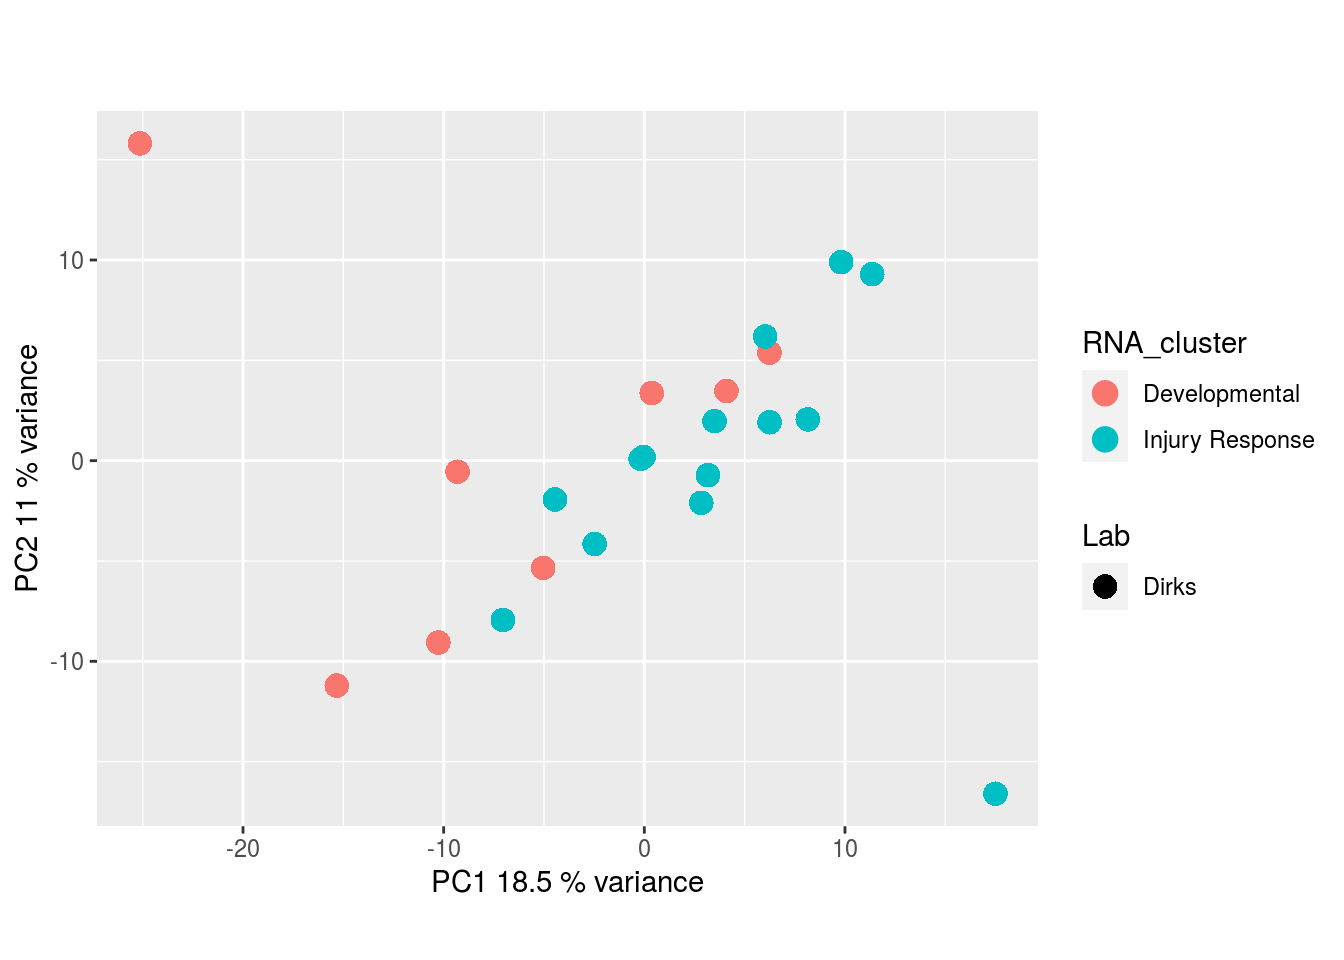
CRISPR Screen:
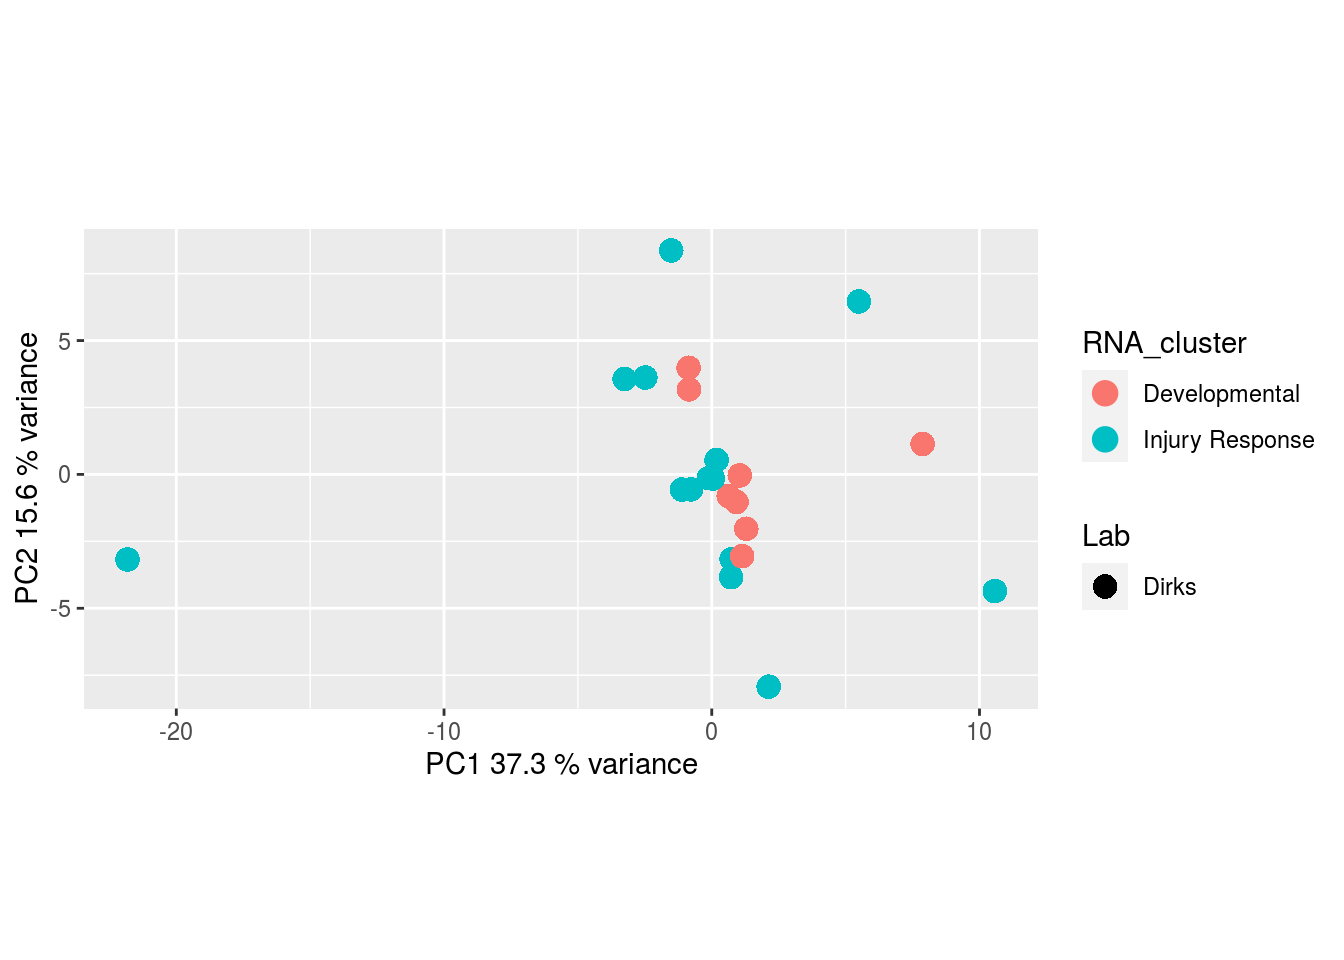
Metabolites, Annotated Cell Extract:
Metabolites, Unannotated Cell Extract:
Metabolites, Annotated Secretion:
I would have expected a common factor to be found for all datatypes, but I'm wondering if there's too much missing data here.
Session Info:
The text was updated successfully, but these errors were encountered: