Data included in the 'input_data' folder are reduced versions of the published originals. We request that you use them only to reproduce our figures, but not for your own research purposes. Instead please go to the original sources:
- SILSO World Data Center
- Chatzistergos, T., Usoskin, I. G., Kovaltsov, G. A., Krivova, N. A. & Solanki, S. K. New reconstruction of the sunspot group numbers since 1739 using direct calibration and "backbone" methods. Astron. & Astrophys. 602, A69 (2017). DOI 10.1051/0004-6361/201630045.
- Cliver, E. W. & Ling, A. G. The Discontinuity Circa 1885 in the Group Sunspot Number. Sol. Phys. 291, 2763–2784 (2016). DOI 10.1007/s11207-015-0841-6.
- Ivanov, V. G. & Miletsky, E. V. Latitude and Power Characteristics of Solar Activity at the End of the Maunder Minimum. Geomagn. Aeron. 57, 788–791 (2017). DOI 10.1134/S0016793217070106.
- Lockwood, M., Owens, M. J. & Barnard, L. Centennial variations in sunspot number, open solar flux, and streamer belt width: 2. Comparison with the geomagnetic data. J. Geophys. Res. (Space Physics) 119, 5183–5192 (2014). DOI 10.1002/2014JA019972.
- Svalgaard, L. & Schatten, K. H. Reconstruction of the Sunspot Group Number: The Backbone Method. Sol. Phys. 291, 2653–2684 (2016). DOI 10.1007/s11207-015-0815-8.
- Vaquero, J. M., Kovaltsov, G. A., Usoskin, I. G., Carrasco, V. M. S. & Gallego, M. C. Level and length of cyclic solar activity during the Maunder minimum as deduced from the active-day statistics. Astron. & Astrophys. 577, A71 (2015). DOI 10.1051/0004-6361/201525962.
- Willamo, T., Usoskin, I. G. & Kovaltsov, G. A. Updated sunspot group number reconstruction for 1749-1996 using the active day fraction method. Astron. & Astrophys. 601, A109 (2017). DOI 10.1051/0004-6361/201629839.
- Zolotova, N. V. & Ponyavin, D. I. The Maunder Minimum is Not as Grand as it Seemed to be. The Astrophys. J. 800, 42 (2015). DOI 10.1088/0004-637X/800/1/42.
- Historical Archive of Sunspot Observations (HASO)
- Arlt, R. The Butterfly Diagram in the Eighteenth Century. Sol. Phys. 255, 143–153 (2009). DOI 10.1007/s11207-008-9306-5.
- Arlt, R., Senthamizh Pavai, V., Schmiel, C. & Spada, F. Sunspot positions, areas, and group tilt angles for 1611-1631 from observations by Christoph Scheiner. Astron. & Astrophys. 595, A104 (2016). DOI 10.1051/0004-6361/201629000.
- Baranyi, T., Györi, L. & Ludmány, A. On-line tools for solar data compiled at the debrecen observatory and their extensions with the greenwich sunspot data. Sol. Phys. 291, 3081–3102 (2016). DOI 10.1007/s11207-016-0930-1.
- Diercke, A., Arlt, R. & Denker, C. Digitization of sunspot drawings by Spörer made in 1861-1894. Astron. Nachrichten 336, 53 (2015). DOI 10.1002/asna.201412138.
- Senthamizh Pavai, V., Arlt, R., Dasi-Espuig, M., Krivova, N. A. & Solanki, S. K. Sunspot areas and tilt angles for solar cycles 7-10. Astron. & Astrophys. 584, A73 (2015). DOI 10.1051/0004-6361/201527080.
- Györi, L., Ludmány, A. & Baranyi, T. Comparative analysis of debrecen sunspot catalogues. Mon. Notices Royal Astron. Soc. 465, 1259 (2017). DOI 10.1093/mnras/stw2667.
- Tlatov, A. G., Makarova, V. V., Skorbezh, N. N. & Muñoz-Jaramillo, A. Kislovodsk mountain astronomical station (kmas) sunspot group data, v2 (2017). DOI 10.7910/DVN/M7NDXN.
- Vaquero, J. M., Gallego, M. C., Usoskin, I. G. & Kovaltsov, G. A. Revisited Sunspot Data: A New Scenario for the Onset of the Maunder Minimum. The Astrophys. J. Lett. 731, L24 (2011). DOI 10.1088/2041-8205/731/2/L24.
- Vaquero, J. M., Nogales, J. M. & Sánchez-Bajo, F. Sunspot latitudes during the Maunder Minimum: A machine-readable catalogue from previous studies. Adv. Space Res. 55, 1546–1552 (2015). DOI 10.1016/j.asr.2015.01.006.
- Vokhmyanin, M. V. & Zolotova, N. V. Sunspot Positions and Areas from Observations by Galileo Galilei. Sol. Phys. 293 (2018). DOI 10.1007/s11207-018-1245-1.
Requirements:
- Anaconda Python 3 installation.
- pyemd package.
You can find instructions for anaconda installation here:
- Anaconda Windows installation instructions.
- Anaconda Mac-OS installation instructions.
- Anaconda Linux installation instructions.
- Start a terminal. You can find instructions for opening terminals here:
- Run the following commands. They will update your python environment and install Pyemd.
conda update --all
conda install astropy
pip install networkx
Click on the Clone or download button and clone it to a repository or download it as a zip file.

If you want help cloning the repository and don't know how to do it let me know. Otherwise, simply download the files and unpack them on a folder in your computer.
-
Open a terminal (see above).
-
Navigate to the folder where you unzipped the repository. Here are some quick tutorials to use the terminal:
- Run the following command:
jupyter notebook --NotebookApp.iopub_data_rate_limit=10000000000
The jupyter notebook command is normally sufficient, but the visualizations I'm including have a data rate limit to high for the defaults. There is a way of fixing this permanently, but you need to mess up with configuration files. More here:
- Open the notebook. Launching jupyter should open the dashboard in your folder. Something that looks like this:
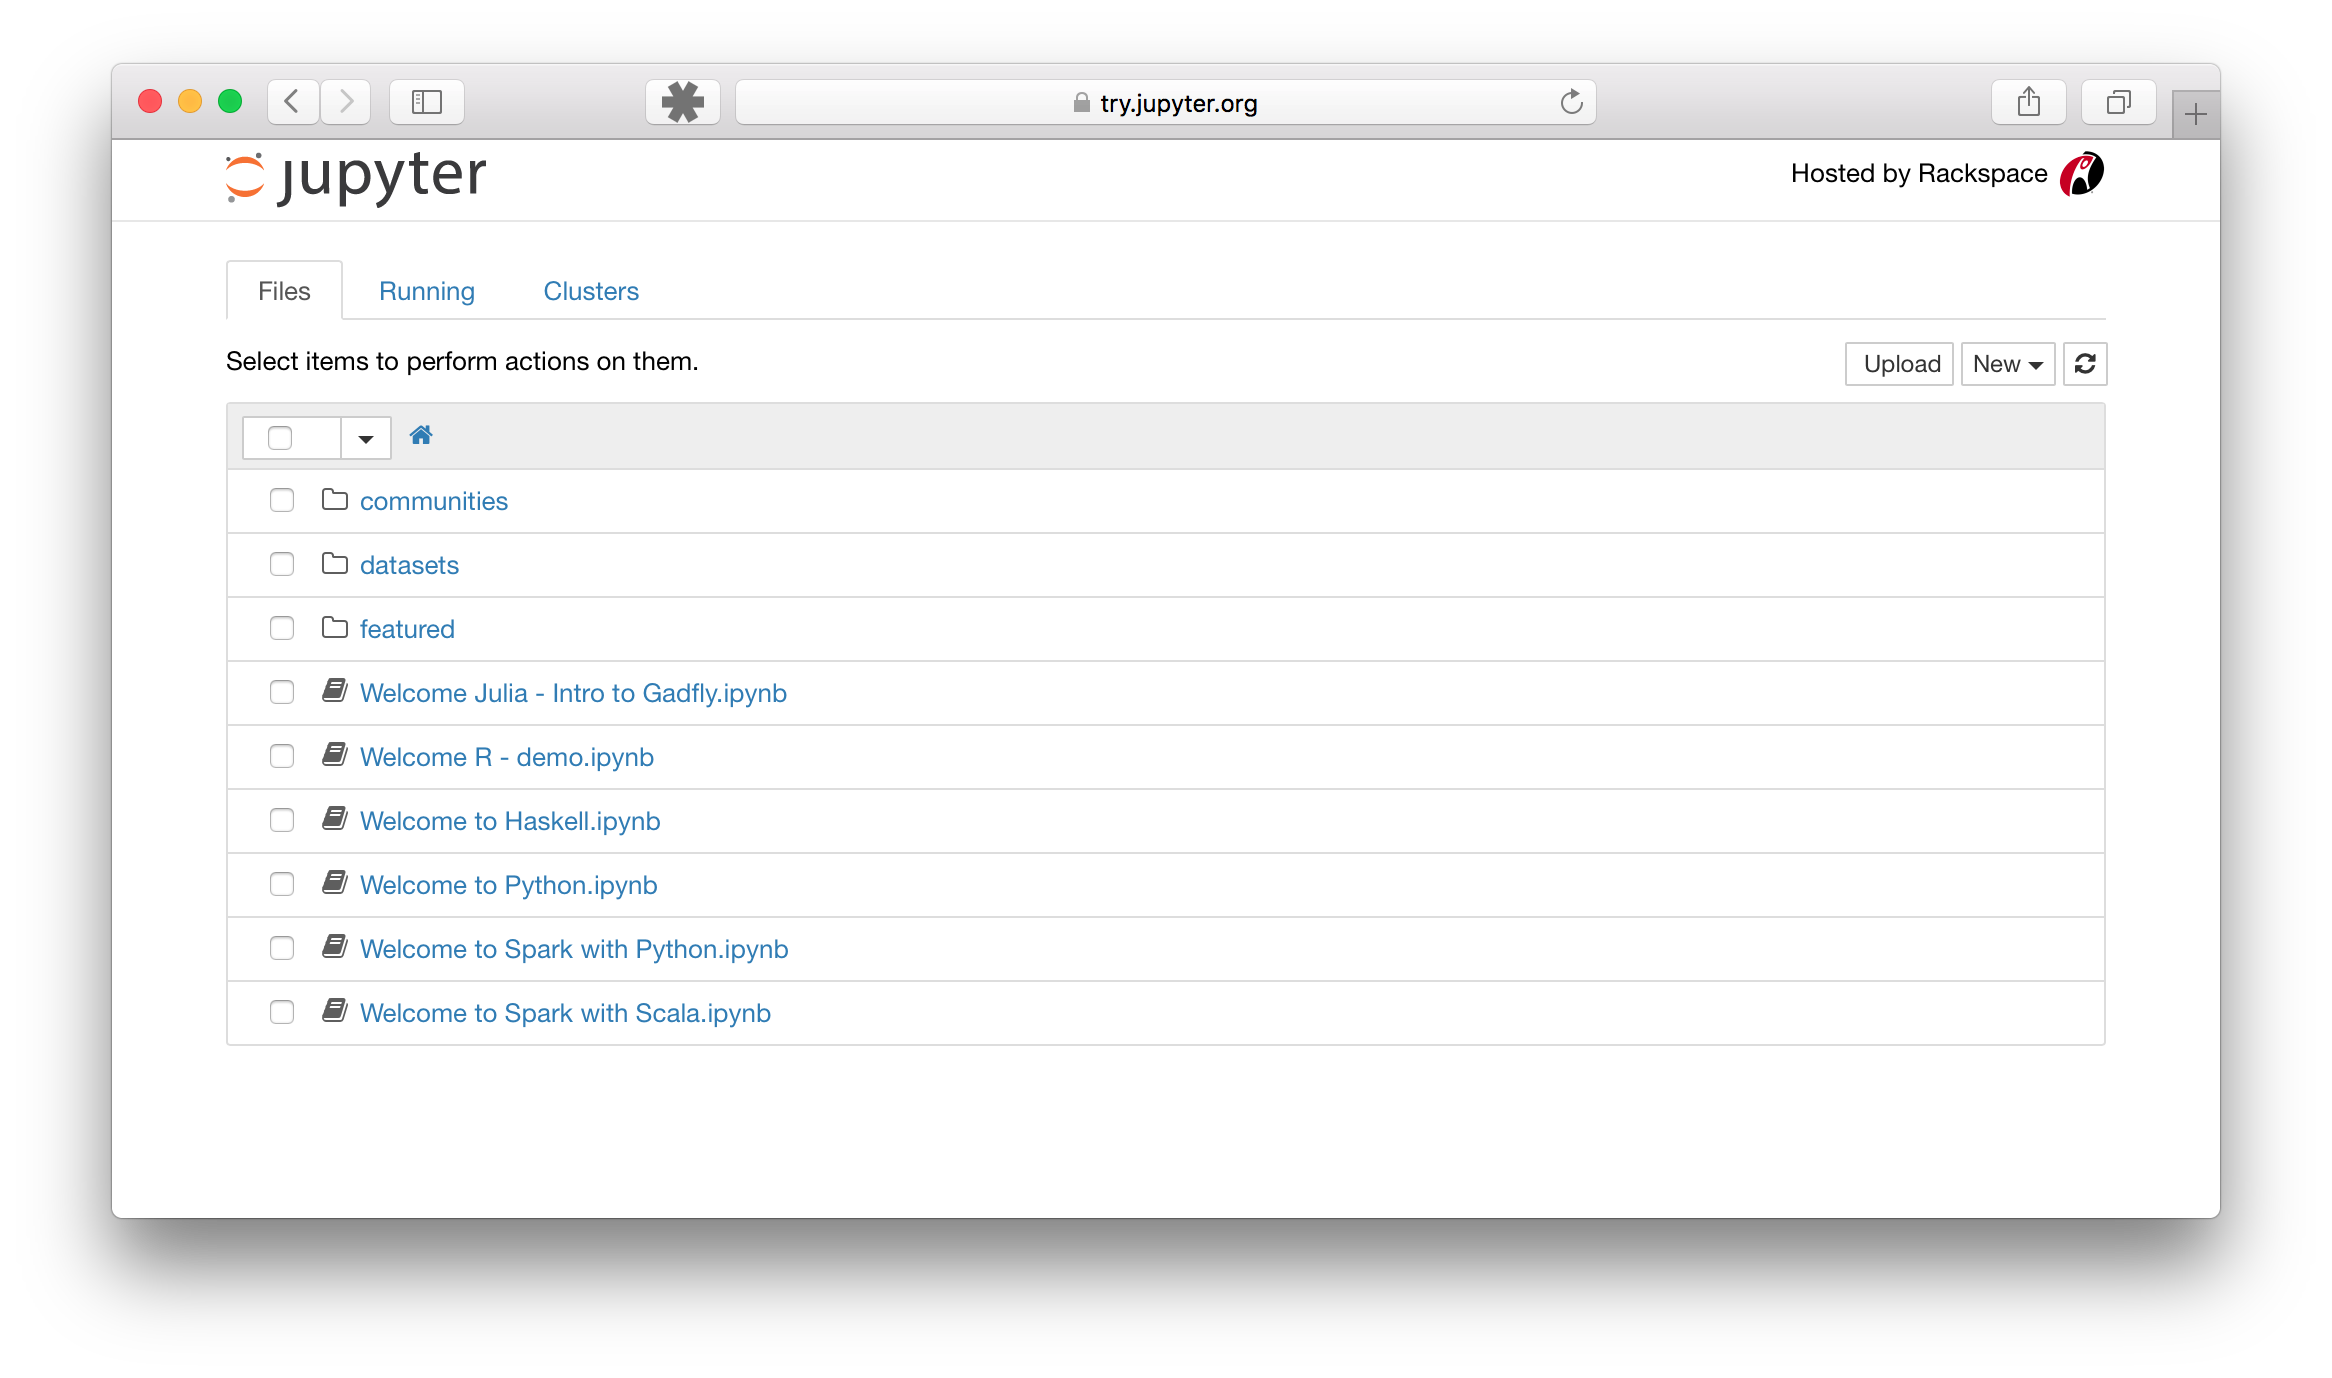
Click on the notebook you want to open.
- Run all cells or the cells you want. For more information about running cells please see:
More information about the Jupyter notebook can be found here: