-
Notifications
You must be signed in to change notification settings - Fork 77
Visualizing issues with secondary locations
- SonarLint version 4.26 or higher.
Supported languages for in-IDE analysis: C, C++, JavaScript, TypeScript
Supported languages for Hotspots and Taint Vulnerabilities: C, C++, C#, VB.NET
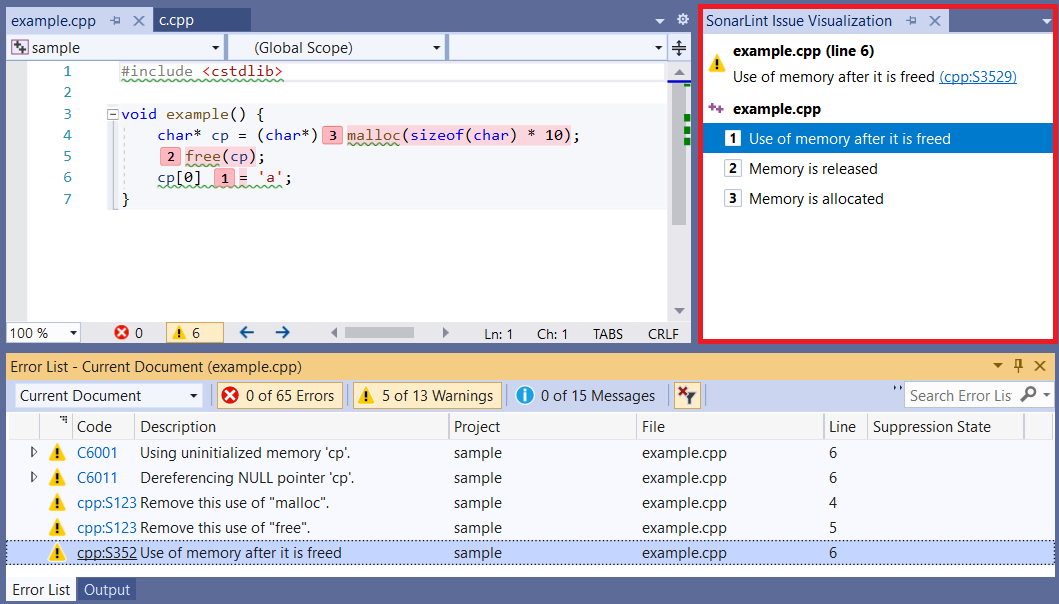
All SonarLint issues specify a location in the code showing where the issue occurs. However, some of the more complex rules produce issues for which a single location is not enough to adequately explain why the issue has occurred. These more complex rules often identify additional locations in the code to help understand the problem. These additional locations are referred to as secondary locations.
For some rules (i.e. cpp:S3529) the secondary locations identify a ‘flow’ through the code that leads to the issue. For other rules (i.e. cpp:S1871), the secondary locations indicate other locations that are related to the issue.
SonarLint for Visual Studio shows these secondary locations in the editor and in a separate tool window.

By default, the tool window will only be visible in the following cases:
- When a Taint Vulnerability is selected in the Taint list.
- When a Hotspot containing secondary locations is selected in the Hotspots list.
- When an issue with secondary locations is selected in the Error List i.e. the window will automatically appear and disappear as the Error List selection changes.
- When lightbulb suggested action "SonarLint: show issue visualization" is invoked. The suggested action will appear when hovering over an issue with secondary locations in the Editor as shown in the following screenshot:
images/SecondaryLocations/SecondaryLoc_lightbulb_v4_26.png
If you manually close the tool window it will no longer appear and disappear automatically. You can show the window again using one of three menu commands:
- The menu command View, Other Windows, SonarLint Issue Visualization, which is always visible
- The lightbulb suggested action SonarLint: show issue visualization when hovering over an issue in the Editor (see screenshot above)
- The Show SonarLint Issue Visualization command on the Error List context menu, which is available for issues with secondary locations as shown in the following screenshot:
images/SecondaryLocations/SecondaryLoc_errorlist_contextmenu_v4_26.png
Selecting a secondary location in the tool window will move the edit cursor to the specified location in the code.
It is also possible to navigate between secondary locations using the keyboard with the following shortcuts:
- Go to next location: Ctrl+Shift+Alt+Q, Ctrl+Shift+Alt+Right Arrow
- Go to next location: Ctrl+Shift+Alt+Q, Ctrl+Shift+Alt+Left Arrow
These shortcut key combinations were chosen to avoid conflicts with existing Visual Studio shortcuts and shortcuts in popular third-party extensions. As always, it is possible to customize these shortcuts in Visual Studio. See the MS documentation for more information.
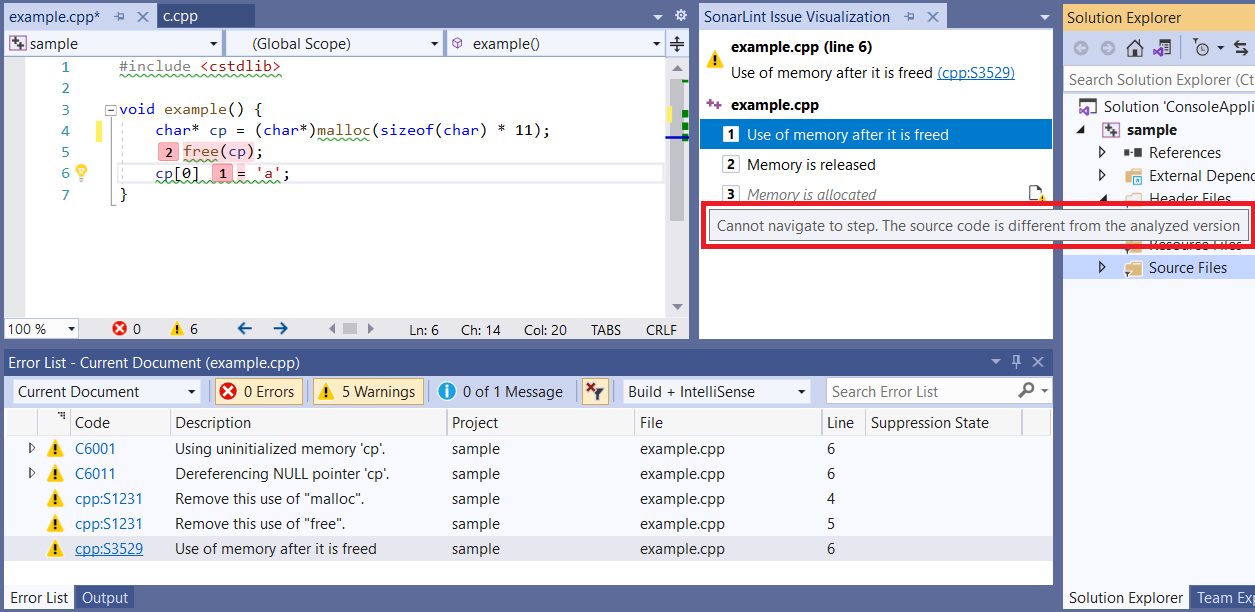
It is not always possible to navigate to a location in the code e.g. because the code has been changed since the file was analyzed, or the source file has been deleted. The tool window will show which locations are non-navigable:

-
Issue Visualization panel no longer appears and disappears automatically: the panel was likely closed manually and therefore needs to be re-open manually (see “Manually re-opening SonarLint Issue Visualization tool window” section for more information).