Analyze the transition of light throughout a video to determine how much of the footage corresponds to different times of the day based on brightness.
- 🌞 Day to Evening
- 🌆 Evening to Night
- 🌃 Night to Morning/Day
Input: Path to a timelapse or transition video
Output:
40%Day/Evening60%Night
or20%Early Morning,10%Night,70%Day
This video is used for the analysis in this project.
day_night_vision.ipynb: Main Jupyter notebook with all the processing steps.brightness_values.txt: Contains brightness data for each extracted video frame.Images/: Contains all extracted frames from the video.
| Library | Purpose |
|---|---|
cv2 |
Reading video, extracting and saving frames |
numpy |
Calculating brightness using mean intensity |
pandas |
(Optional) For data handling (if extended) |
matplotlib |
Plotting brightness trends and charts |
This line graph shows how brightness fluctuates across the video timeline.
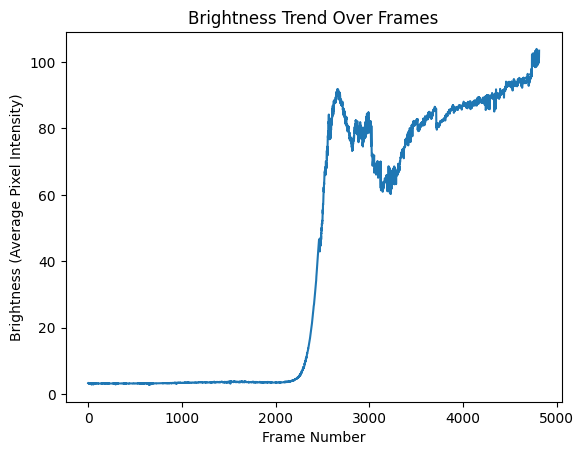
Frames are categorized into:
- ☀️ Morning (Brightness: 60–100)
- 🌇 Sunset (Brightness: 40–60)
- 🌃 Night (Brightness: 0–40)
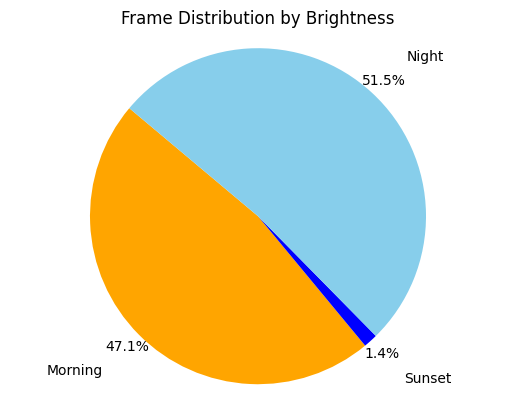
Distribution based on average brightness per frame:

Shows proportion of frames in each category:
-
Read the Video
Usingcv2.VideoCaptureto read frames fromSample.mp4. -
Extract Frames
Frames are saved as.pngfiles for analysis. -
Calculate Brightness
Each frame is converted to grayscale and average brightness is calculated usingnumpy. -
Save Brightness Data
All brightness values are stored inbrightness_values.txt. -
Categorize Frames
Based on brightness, frames are classified into Morning, Sunset, or Night. -
Visualize Data
Usedmatplotlibto generate trend lines, bar graphs, and pie charts.
Example Output: