Building charts from queries is easier than ever.
Clients have a #draw method which accepts a query, a DOM node and a configuration object as arguments. You can call this directly on the client, which will execute a request and visualize its response, like so:
client.draw(query, node, config);Keen.ready(function(){
var query = new Keen.Query("count", {
eventCollection: "pageviews",
groupBy: "visitor.geo.country"
interval: "daily",
timeframe: "this_21_days"
});
var chart = client.draw(query, document.getElementById("chart-wrapper"), {
title: "Custom chart title",
chartType: "columnchart"
});
});Charts can also be instantiated with the Keen.Dataviz object. Learn more about this object here.
Keen.ready(function(){

  var chart = new Keen.Dataviz()
    .el(document.getElementById("chart-wrapper"))
    .chartType("columnchart")
    .prepare(); // start spinner

  var req = client.run(query, function(err, res){
    if (err) {
      // Display the API error
      chart.error(err.message);
    }
    else {
      // Handle the response
      chart
        .parseRequest(this)
        .title("Custom chart title")
        .render();
    }
  });

  // Re-run and refresh every 15 minutes...
  setInterval(req.refresh, 1000 * 60 * 15);

});The second argument for the #draw method is a reference to the DOM element where your chart will appear. This should be a block level element, like a <div> tag, referenced by its ID attribute:
document.getElementById("chart-wrapper")
{
  colors: [ "#ff0000", "#222", "lightblue" ],
  title: "My chart title!",
  height: 400,
  width: 600,
  colorMapping: {},
  labelMapping: {},
  labels: [],
  chartOptions: {
    // pass directly through to underlying vizz library
  }
}labelMapping: object that selectively replaces previous values with desired values:
labelMapping: {
  "https://yourdomain.com/": "Home",
  "https://yourdomain.com/gallery.html": "Gallery"
}labels: array that totally replaces all values (useful for funnels):
{
  labels: [
    "Step 1",
    "Step 2 (75%)",
    "Step 3 (50%)",
    "Step 4 (12%)"
  ]
}colorMapping: object that corresponds labels (key) with desired colors (value).
colorMapping: {
  "Home": "#ff0000",
  "Gallery": "purple"
}chartOptions: config object passed to the underlying visualization library (Google Charts).
chartOptions: {
  isStacked: true,
  legend: { position: "none" },
  bar: {
    groupWidth: "90%"
  }
}chartType: string identifying the type of chart to render:
Area, bar, column and line charts all operate on the same underlying query/response type: numeric values on an interval. So, the demos for these chart types will all utilize the following query, but will specify their own respective chartType property.
var total_pageviews = new Keen.Query("count", {
  eventCollection: "pageviews",
  groupBy: "channel",
  timeframe: "this_3_days",
  interval: "daily"
});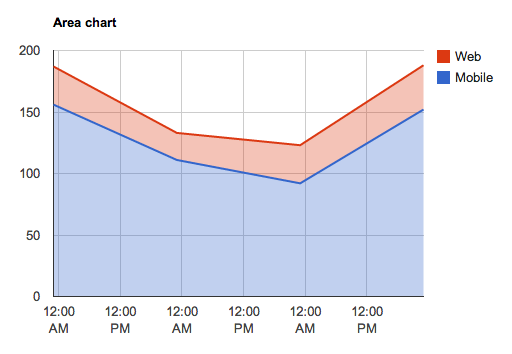
client.draw(total_pageviews, document.getElementById("total-daily-revenue-areachart"), {
  chartType: "areachart",
  title: "Daily revenue (7 days)",
  chartOptions: {
    isStacked: true
  }
});
<div id="total-daily-revenue-areachart"></div>
Find additional configuration options for area charts here.
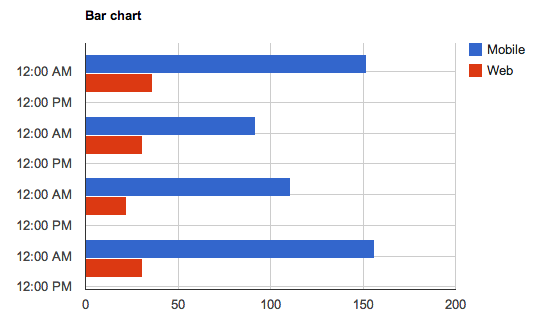
client.draw(total_pageviews, document.getElementById("total-daily-revenue-barchart"), {
  chartType: "barchart",
  title: "Daily revenue (7 days)",
  chartOptions: {
    isStacked: true
  }
});
<div id="total-daily-revenue-barchart"></div>
Find additional configuration options for bar charts here.
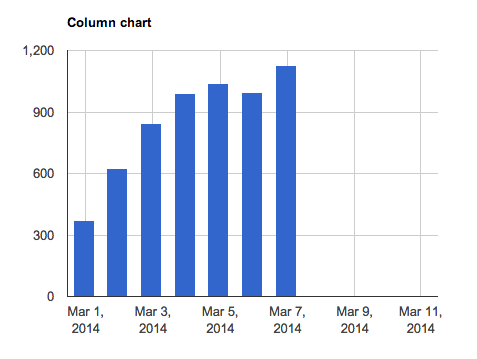
client.draw(total_pageviews, document.getElementById("total-daily-revenue-columnchart"), {
  chartType: "columnchart",
  title: "Daily revenue (7 days)",
  chartOptions: {
    isStacked: true
  }
});<div id="total-daily-revenue-columnchart"></div>Find additional configuration options for column charts here.
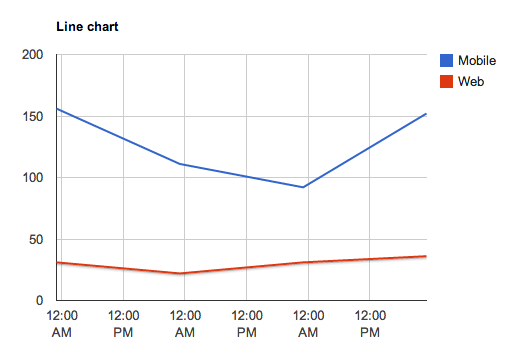
client.draw(total_pageviews, document.getElementById("total-daily-revenue-linechart"), {
  chartType: "linechart",
  title: "Daily revenue (7 days)"
});<div id="total-daily-revenue-linechart"></div>Find additional configuration options for line charts here.
Visualize single numeric query responses, such as a count, sum, average, etc.
var count = new Keen.Query("count", {
  eventCollection: "pageviews"
});
client.draw(count, document.getElementById("count-pageviews-metric"), {
  chartType: "metric",
  title: "Total Pageviews",
  colors: ["#49c5b1"]
});<div id="count-pageviews-metric"></div>Additional options
chartOptions.prefix: string to prepend to the beginning of the result valuechartOptions.suffix: string to append to the end of the result valuechartOptions.prettyNumber: use short syntax to render numbers (eg: 300k), enabled by default
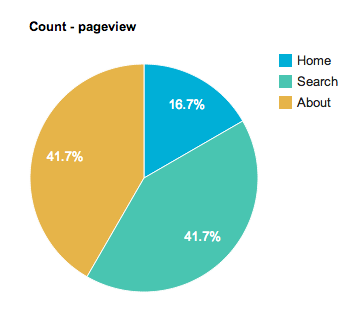
Pie charts can render groupBy queries that do not include an interval.
var visitor_origins = new Keen.Query("count", {
  eventCollection: "pageviews",
  groupBy: "referrer"
});
client.draw(visitor_origins, document.getElementById("count-pageviews-piechart"), {
  chartType: "piechart",
  title: "Visitor Referrers"
});
<div id="count-pageviews-piechart"></div>
Tables can render any query response, including extractions.
var all = new Keen.Query("extraction", {
  eventCollection: "pageviews",
  timeframe: "this_7_days"
});
client.draw(all, document.getElementById("extract-pageviews-table"), {
  chartType: "table",
  title: "All page view data"
});<div id="extract-pageviews-table"></div>Find additional configuration options for tables here.
Funnels are a fancy analysis type that allow you to see what percentage of users (or devices) complete various steps.

var watch_activation_funnel = new Keen.Query("funnel", {
  steps: [
    {
       event_collection: "purchases",
       actor_property: "user.id",
       filters: [
          {
            "property_name" : "product",
            "operator" : "eq",
            "property_value" : "telekinetic watch"
          }
       ],
       timeframe: "last_7_days"
    },
    {
      event_collection: "activations", // how many activated the device?
      actor_property: "user.id",
      optional: true
    },
    {
      event_collection: "sessions", // how many had a session?
      actor_property: "user.id",
      optional: true
    },
    {
      event_collection: "sessions",
      actor_property: "user.id",
      filters: [
          {
            "property_name" : "lifetime_session_count",
            "operator" : "gt",
            "property_value" : 1 // how many had more than 1 session
          }
       ],
       optional: true
    },
    {
      event_collection: "send_invitations",
      actor_property: "user.id"
    }
  ]
});

client.draw(watch_activation_funnel, document.getElementById("chart-05"), {
  library: "google",
  chartType: "barchart", // or "columnchart"
  height: 340,
  title: null,
  colors: ["#79CDCD"],
  labels: [ "Purchased Device", "Activated Device", "First Session", "Second Session", "Invited Friend" ],
  chartOptions: {
    chartArea: { height: "85%", left: "20%", top: "5%" },
    legend: { position: "none" }
  }
});To display a modified query result or data from another source into a visualization, pass a result object and a div to Keen.Dataviz. The Keen IO API docs describe what the results look like for all the different query types (counts, series, funnels, etc).
Here's an example that takes a hard-coded value "1896" and draws it as a number.
  var chart = new Keen.Dataviz()
    .el(document.getElementById('my-div'))
    .parseRawData({ result: 1896 })
    .chartType("metric")
    .colors(["#6ab975"])
    .title("Wow!")
    .width(400)
.render();Here's an example that runs two queries, divides them, and then outputs the results:
  var sessions_count = new Keen.Query("count_unique", {
    eventCollection: "screen_view", // Use this collection because there is at least 1 screenview per session
    targetProperty: "session.id",
    timeframe: "last_7_days"
  });

  var paid_sessions_count = new Keen.Query("count_unique", { // Find number of sessions with payments
    eventCollection: "payment",
    targetProperty: "session.id",
    timeframe: "last_7_days"
  });

  var chart = Keen.Dataviz()
    .el(document.getElementById("paid-session-conversion"))
    .colors(["#6ab975"])
    .title("Conversion %")
    .width(400)
    .prepare(); // start spinner

  // Send query to Keen IO
  var mashup = client.run([sessions_count, paid_sessions_count], function(err, res){
    if (err) {
      // Display the API error
      chart.error(err.message);
    }
    else {
      // divide paid sessions by sessions to get conversion rate
      chart
        .parseRawData({
          result: (res[1].result/res[0].result).toFixed(2) * 100
        })
        .render();
    }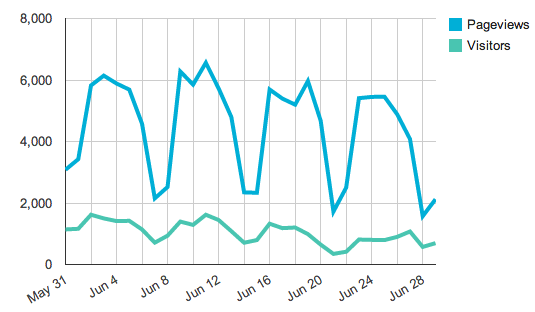
});Here's an example that takes the data from two different line charts and plots them both onto the same graph.
// use a variable to ensure timeframe & interval for both queries match
var interval = "daily"
var timeframe = "last_30_days"

var pageviews = new Keen.Query("count", { // first query
	eventCollection: "pageviews",
	interval: interval,
	timeframe: timeframe
});

var uniqueVisitors = new Keen.Query("count_unique", { // second query
	eventCollection: "pageviews",
	targetProperty: "uuid",
	interval: interval,
	timeframe: timeframe
});

var chart = new Keen.Dataviz()
  .el(document.getElementById("visitors-uniques"))
  .chartType("linechart")
  .chartOptions({
    hAxis: {
      format:'MMM d',
      gridlines:  {count: 12}
    }
  })
  .prepare();

client.run([pageviews, uniqueVisitors], function(err, res){ // run the queries

	var result1 = res[0].result  // data from first query
	var result2 = res[1].result  // data from second query
	var data = []  // place for combined results
	var i=0

	while (i < result1.length) {

		data[i]={ // format the data so it can be charted
			timeframe: result1[i]["timeframe"],
			value: [
				{ category: "Pageviews", result: result1[i]["value"] },
				{ category: "Visitors", result: result2[i]["value"] }
			]
		}
		if (i == result1.length-1) { // chart the data
      chart
        .parseRawData({ result: data })
        .render();
		}
		i++;
	}
});