This demo is for a local setup only, running K8S on a Mac, Docker Desktop. It shows you how to monitor a third party application, like MongoDB, in your Kubernetes cluster using Prometheus monitoring with Grafana as the visualization tool.


Create a base64 encoded username and password for MongoDB:
echo -n 'username' | base64
echo -n 'password' | base64
Use something other than 'username' and 'password' of course.
Create a secret file: mongo-secret.yaml
Put the base64 encoded values into a mongo-secret.yaml file in the root directory:
apiVersion: v1
kind: Secret
metadata:
  name: mongodb-secret
type: Opaque
data:
  mongo-root-username:
  mongo-root-password:
Run the apply commands for mongo setup:
kubectl apply -f mongo-secret.yaml
kubectl apply -f mongo.yaml
kubectl apply -f mongo-configmap.yaml
kubectl apply -f mongo-express.yaml
Create a monitoring namespace if you do not already have one:
kubectl create namespace monitoringInstall Helm
Setup Prometheus and Grafana with Helm:
helm repo add prometheus-community https://prometheus-community.github.io/helm-charts
helm repo update
helm install kube-prometheus-stack prometheus-community/kube-prometheus-stack -f kube-prometheus-stack-values.yaml
kubectl --namespace monitoring get pods
You may need this patch if running Docker Desktop on a Mac:
kubectl patch daemonset.apps/kube-prometheus-stack-prometheus-node-exporter --type "json" -p '[{"op": "remove", "path" : "/spec/template/spec/containers/0/volumeMounts/2/mountPropagation"}]'Port forward Prometheus to access it as a service
kubectl port-forward service/kube-prometheus-stack-prometheus 9090Port forward Grafana to access it from localhost:
kubectl port-forward deployment/kube-prometheus-stack-grafana 3000Port forward mongo express to access it from localhost:
kubectl port-forward service/mongo-express-service 8081Now install and port forward the MongoDB exporter to collect metrics from mongodb:
helm install mongodb-exporter prometheus-community/prometheus-mongodb-exporter -f mongo-exporter-values.yamlPort forward if you want to check the /metrics endpoint:
kubectl port-forward service/mongodb-exporter-prometheus-mongodb-exporter 9216Navigate to the port forwarded URL for grafana: http://127.0.0.1:3000
Default login for grafana: Username: admin Password: prom-operator
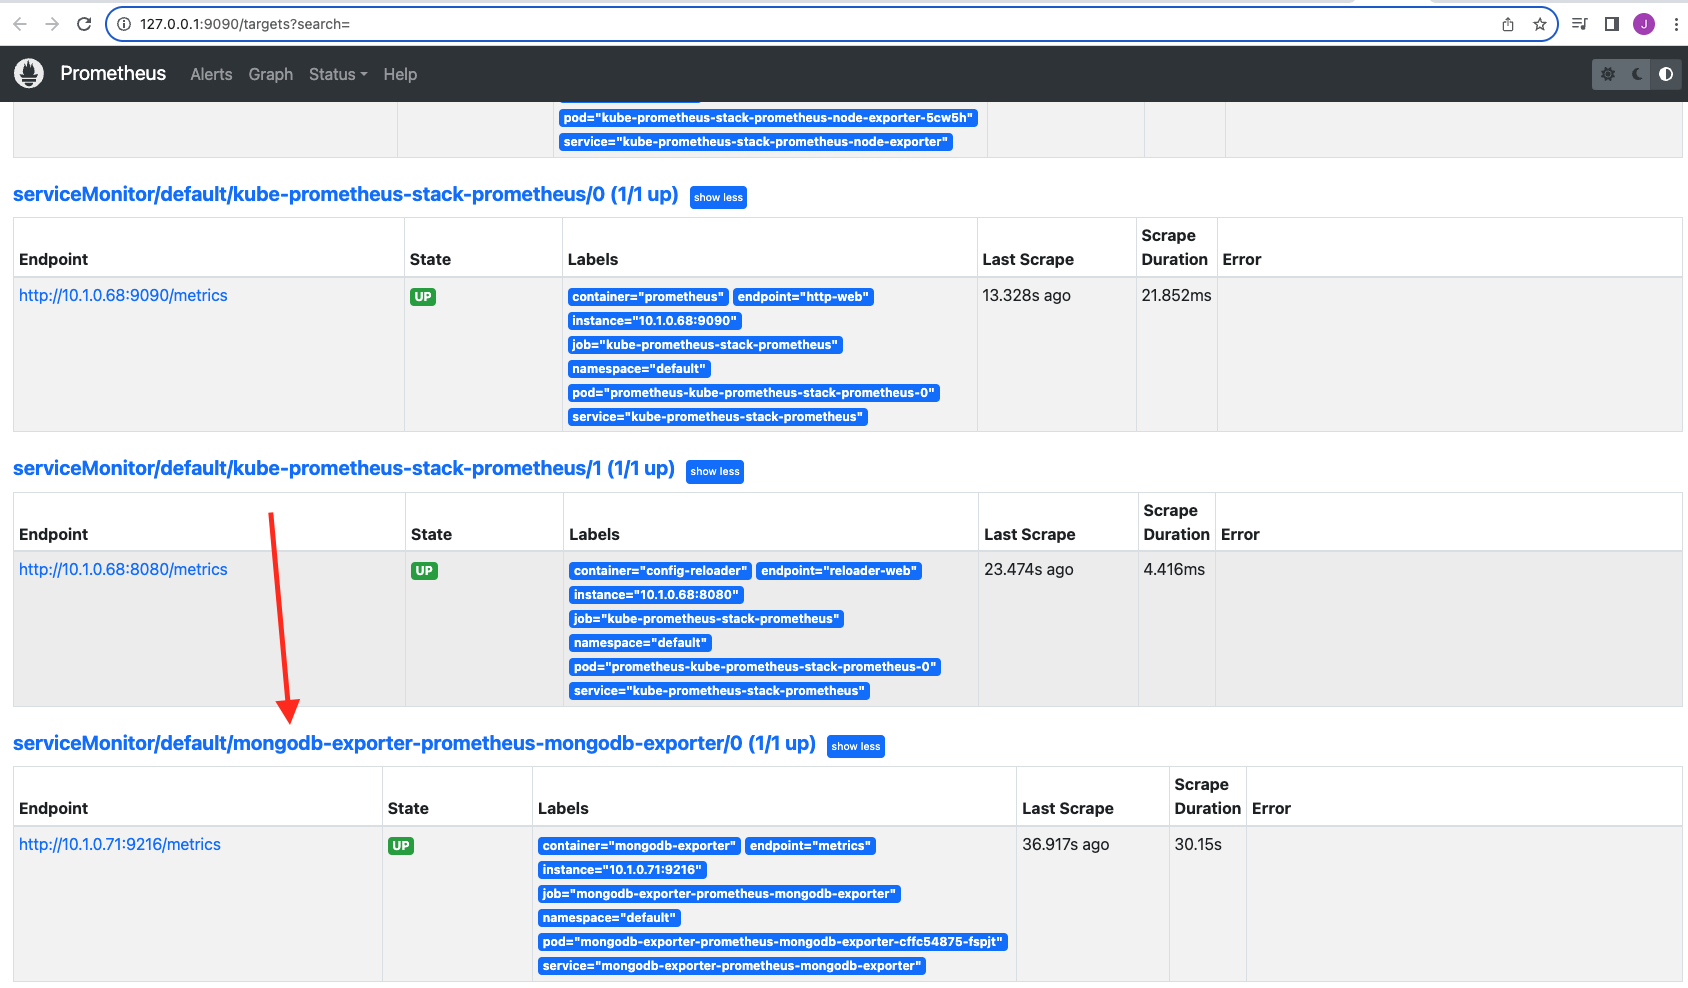
Navigate to Prometheus and check targets: http://127.0.0.1:9090/targets
Navigate to Mongo Express and make some changes: http://127.0.0.1:8081/
Of course, this demo is not stateful, so there is no backend persistent disk for MongoDB. As such, any MongoDB changes will be gone if the cluster or pod restarts.
Tear down prometheus and grafana:
helm uninstall mongodb-exporter
helm uninstall kube-prometheus-stack