Skip to content

Latest commit


History

History

plots

Folders and files

NameName
Last commit message
Last commit date

parent directory

..


Plots on the Results

Navigating LLM Semantic Web Technology Support with Capability Compass

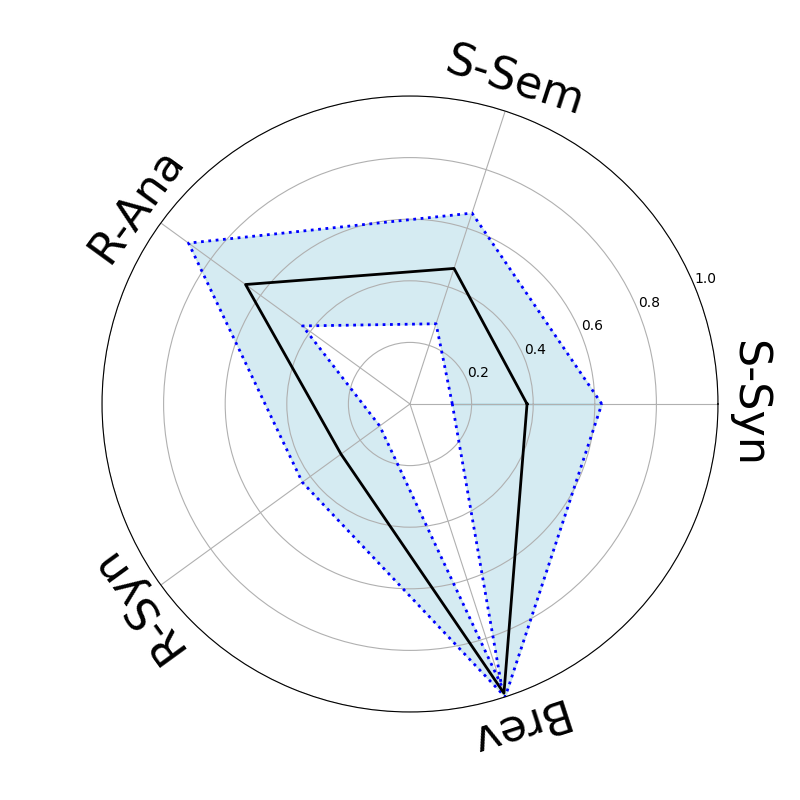
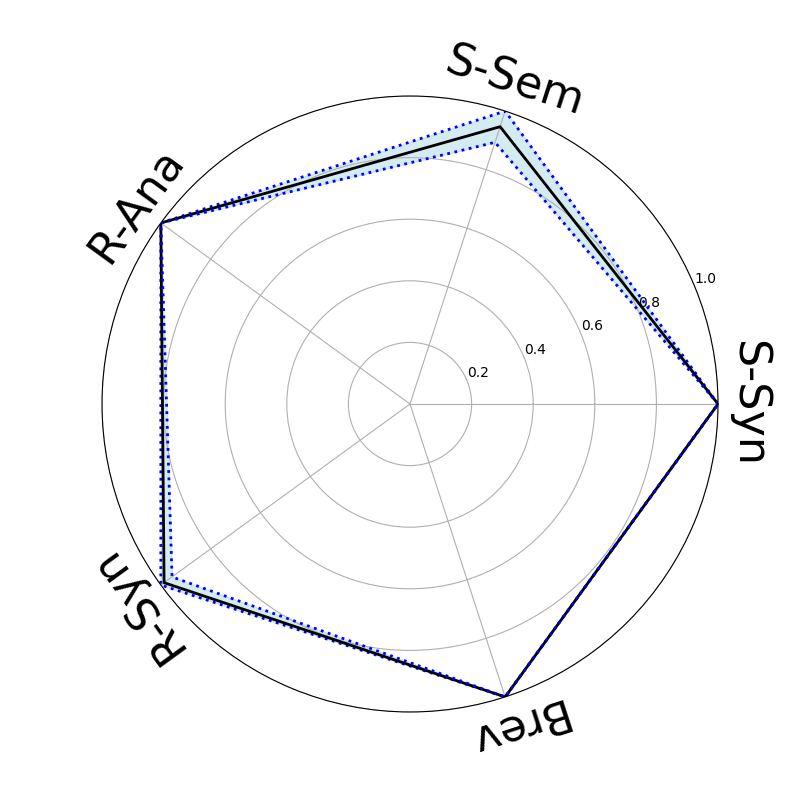
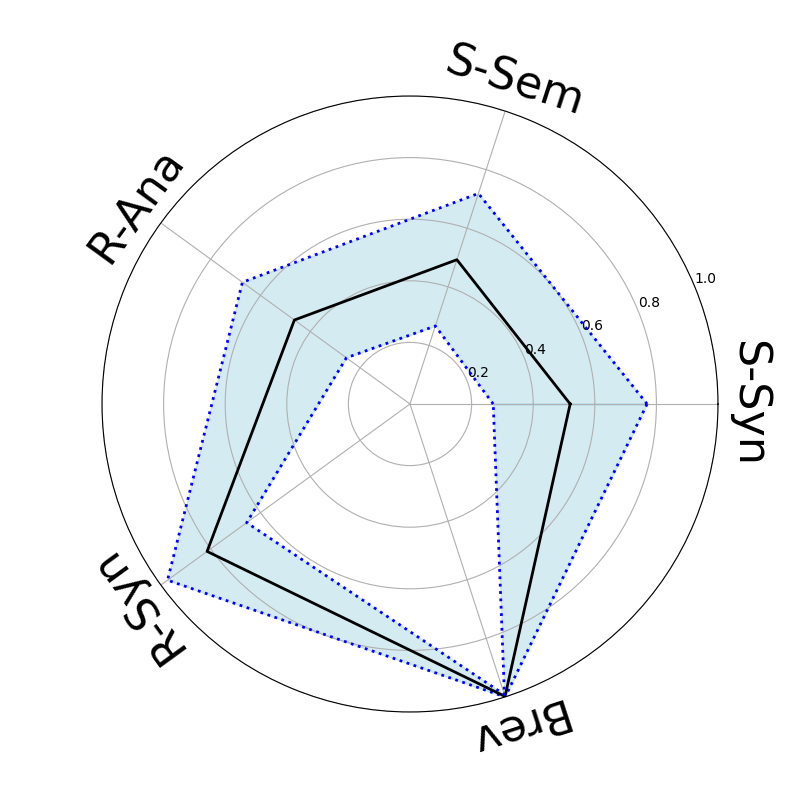
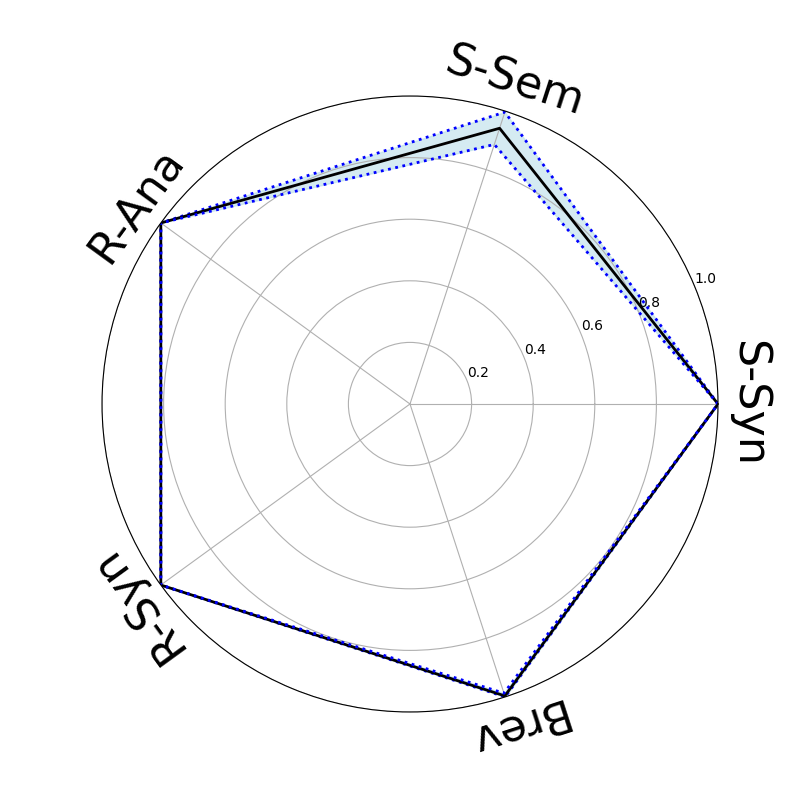
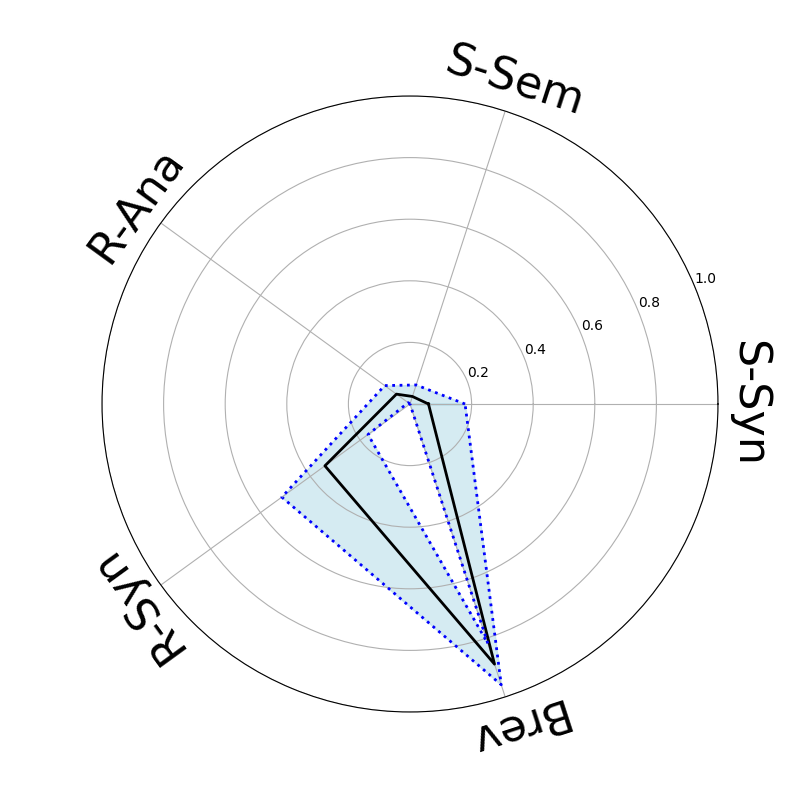
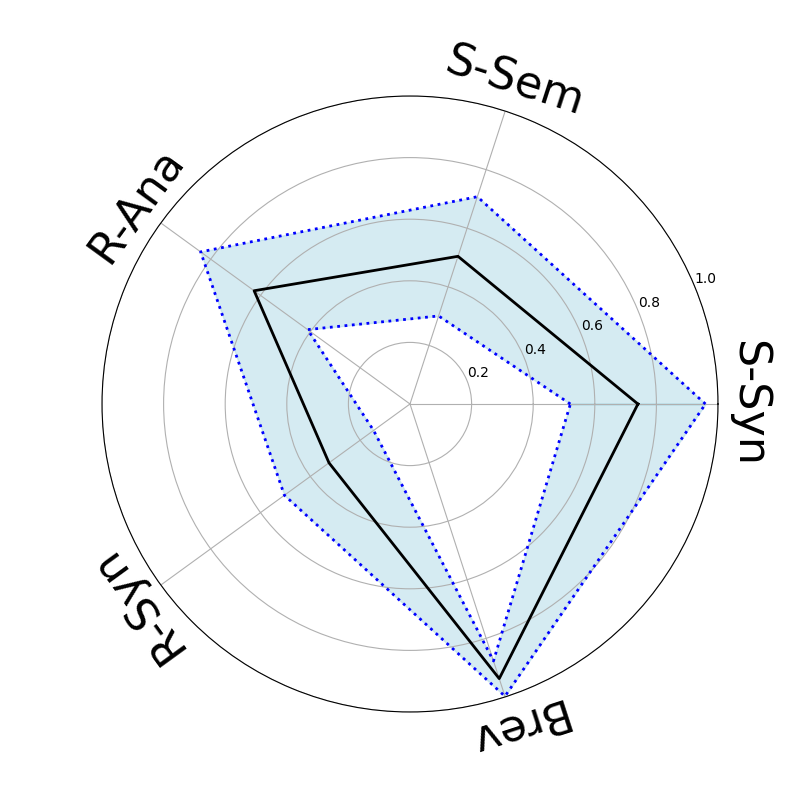
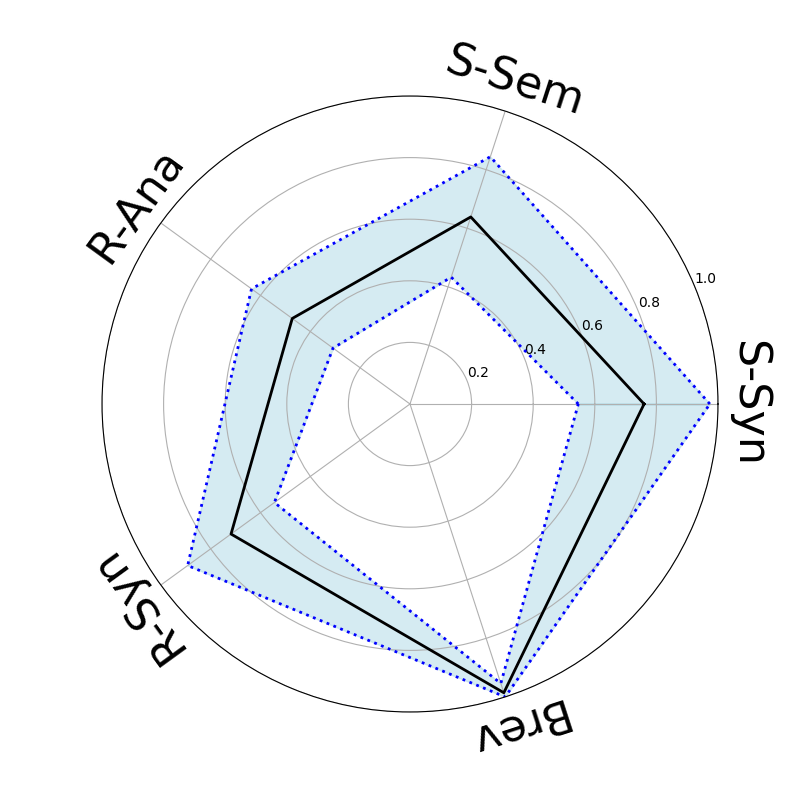
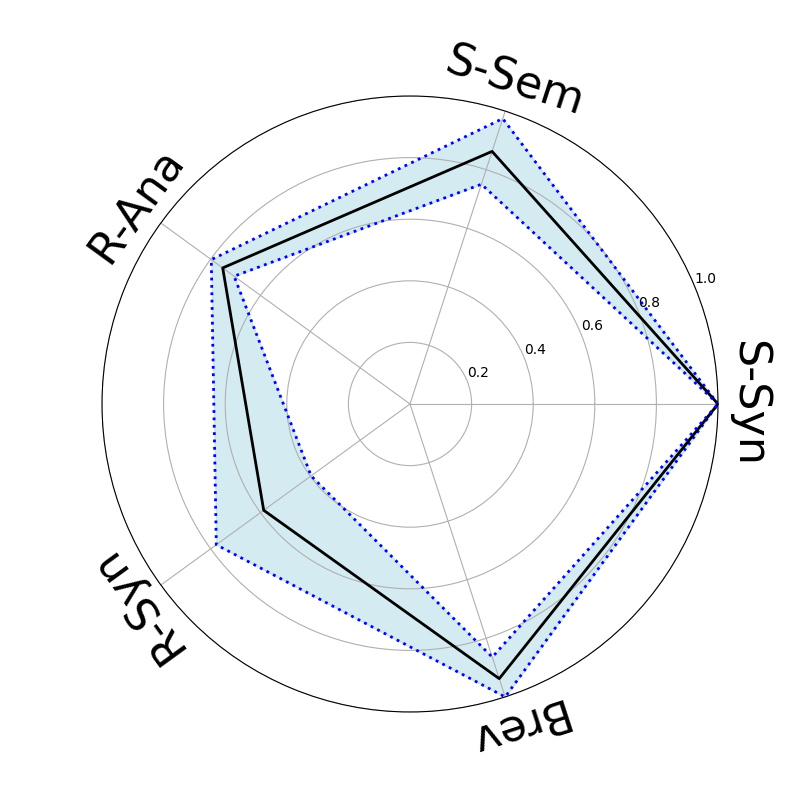
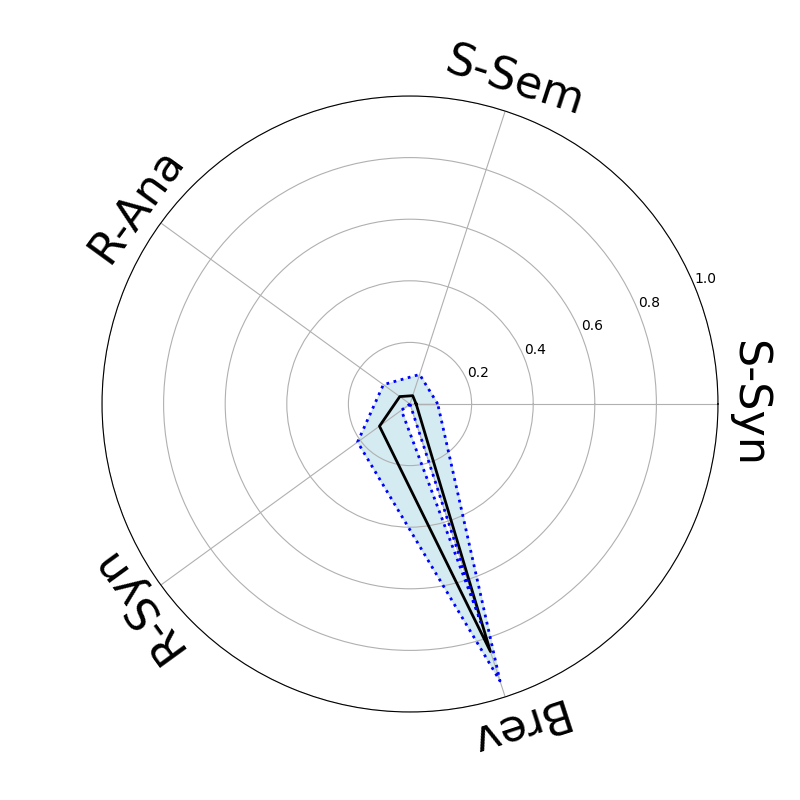
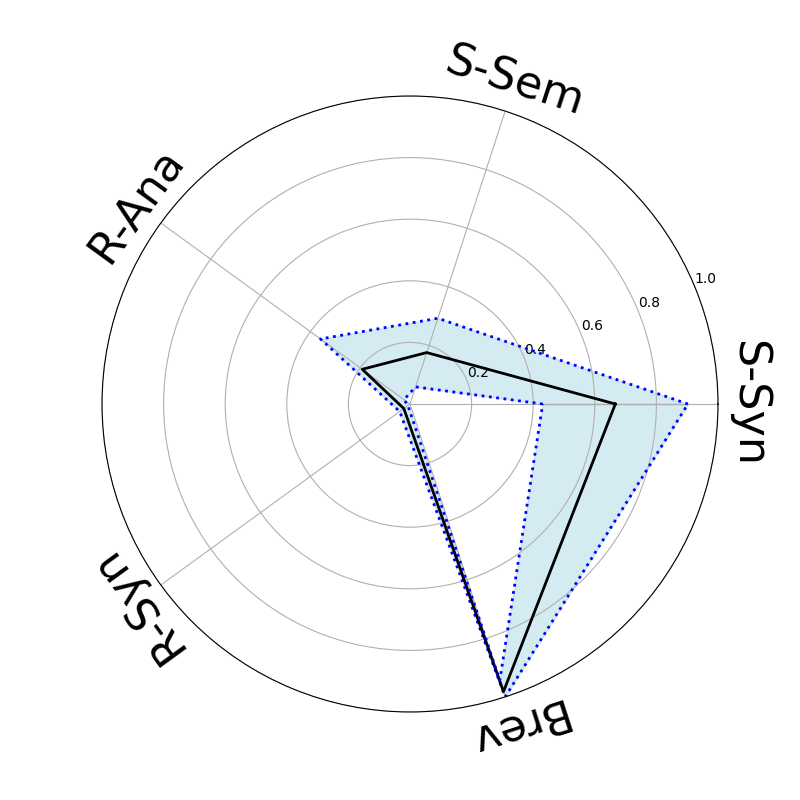
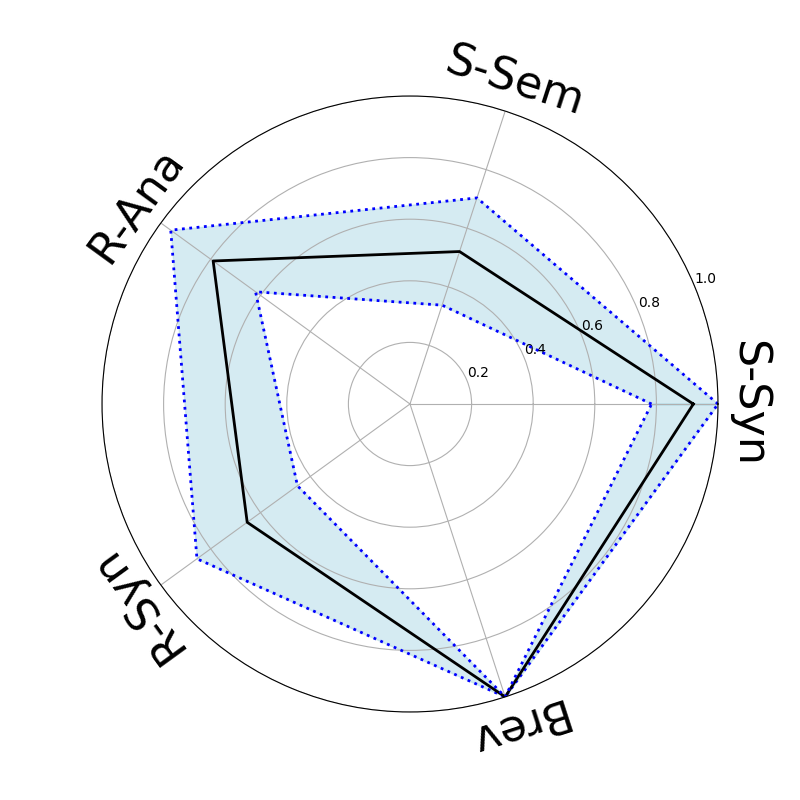
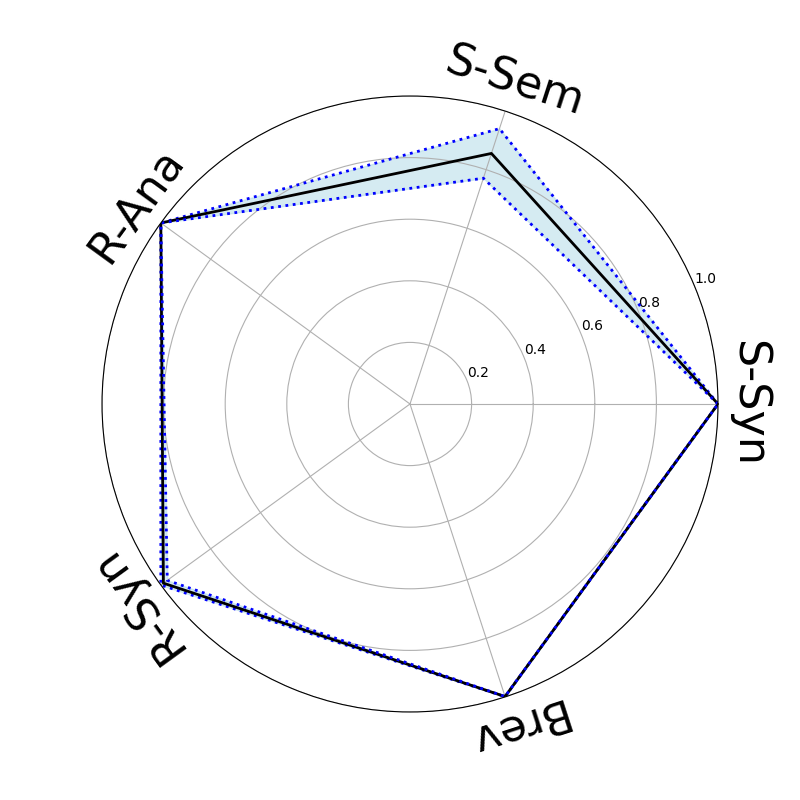
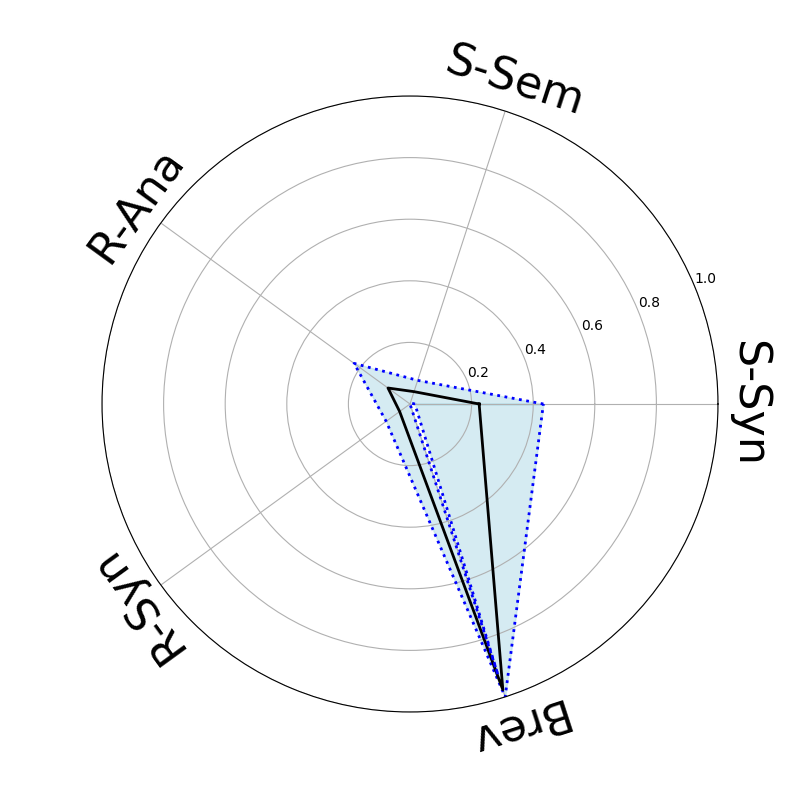
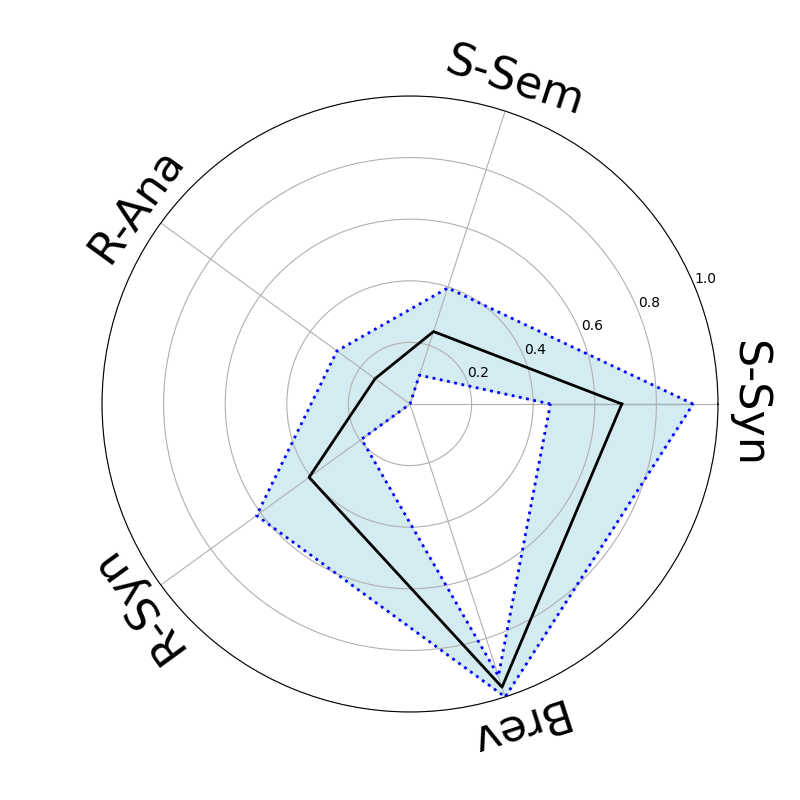
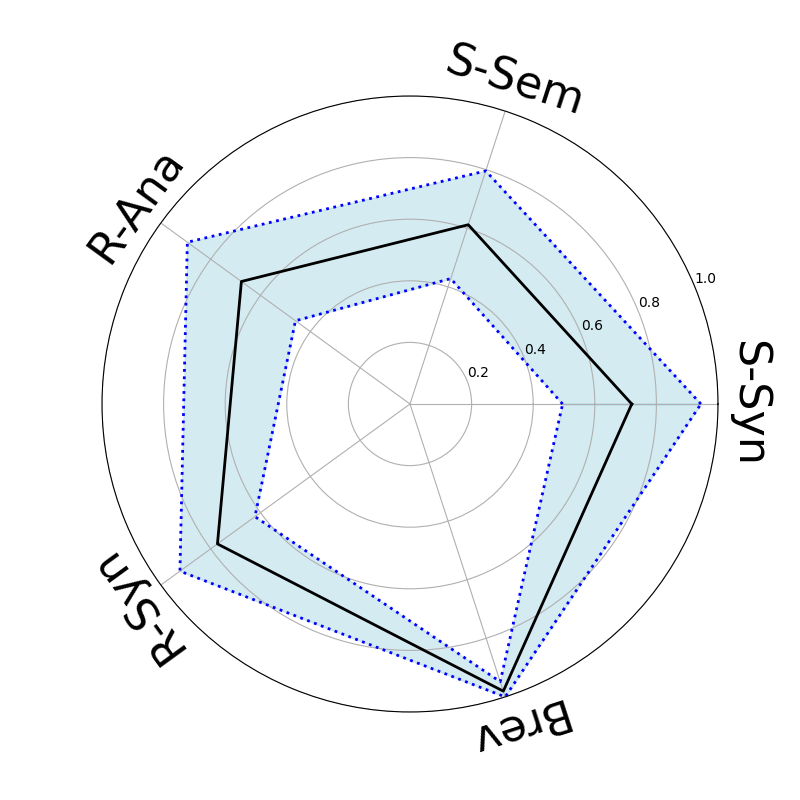
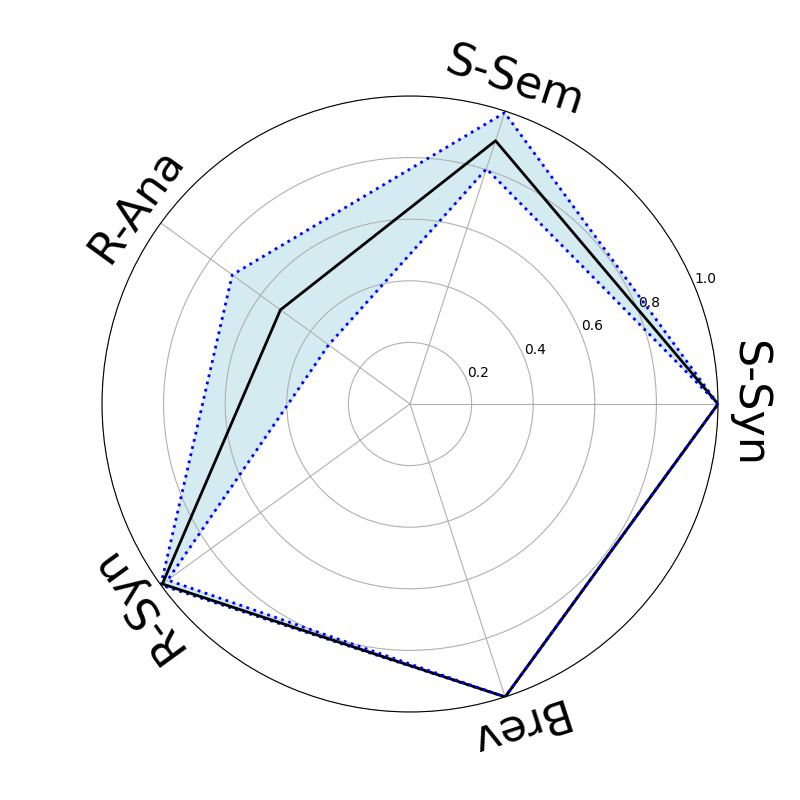
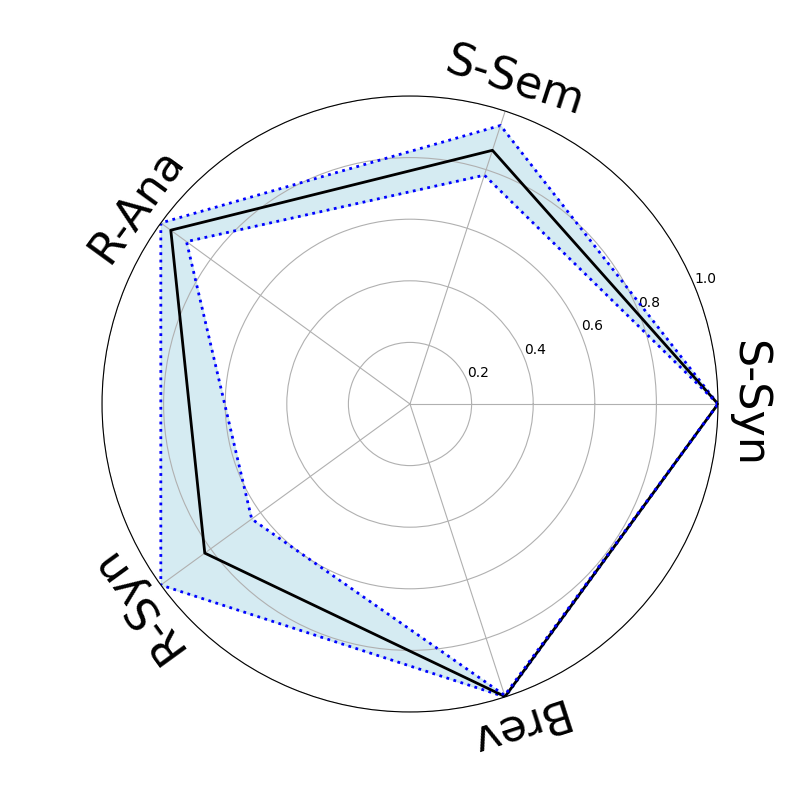
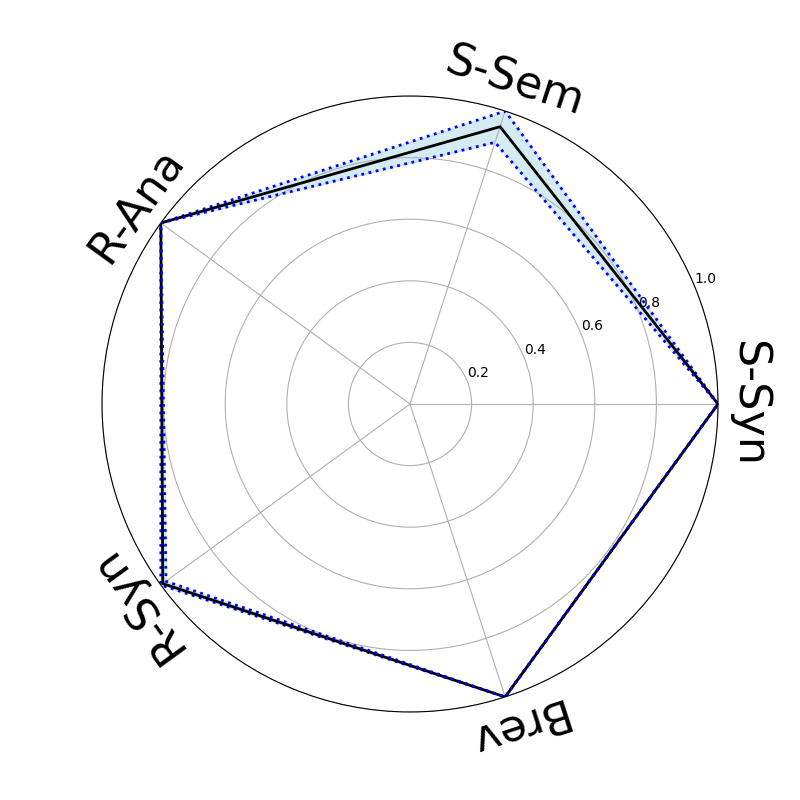
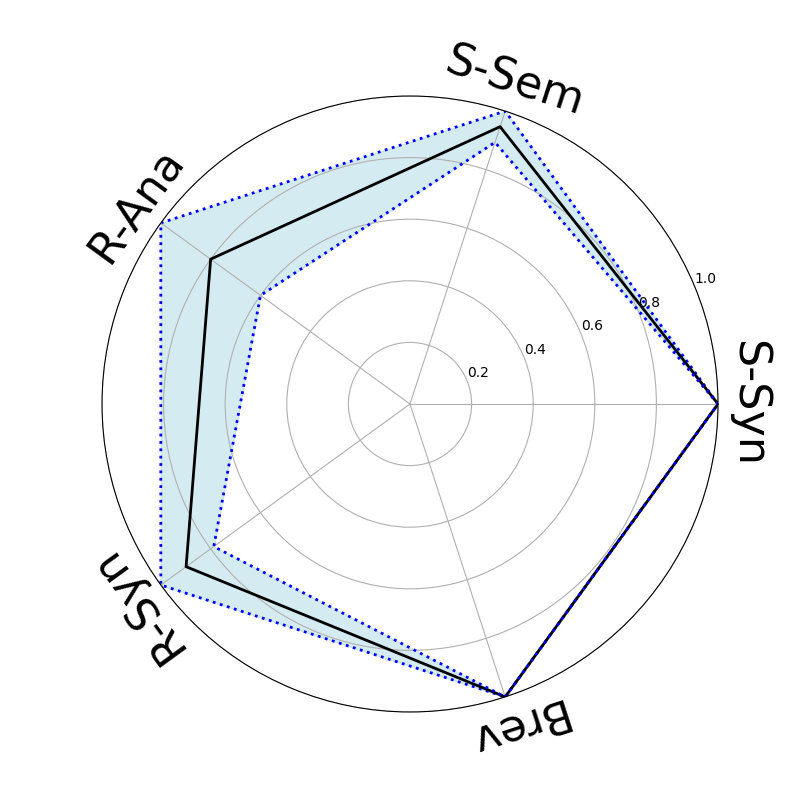
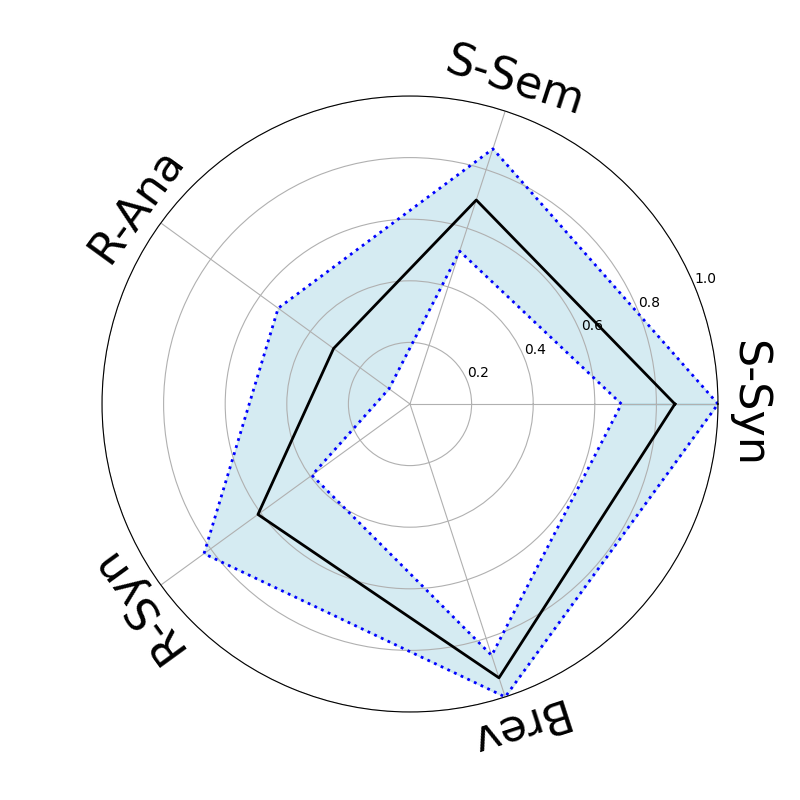
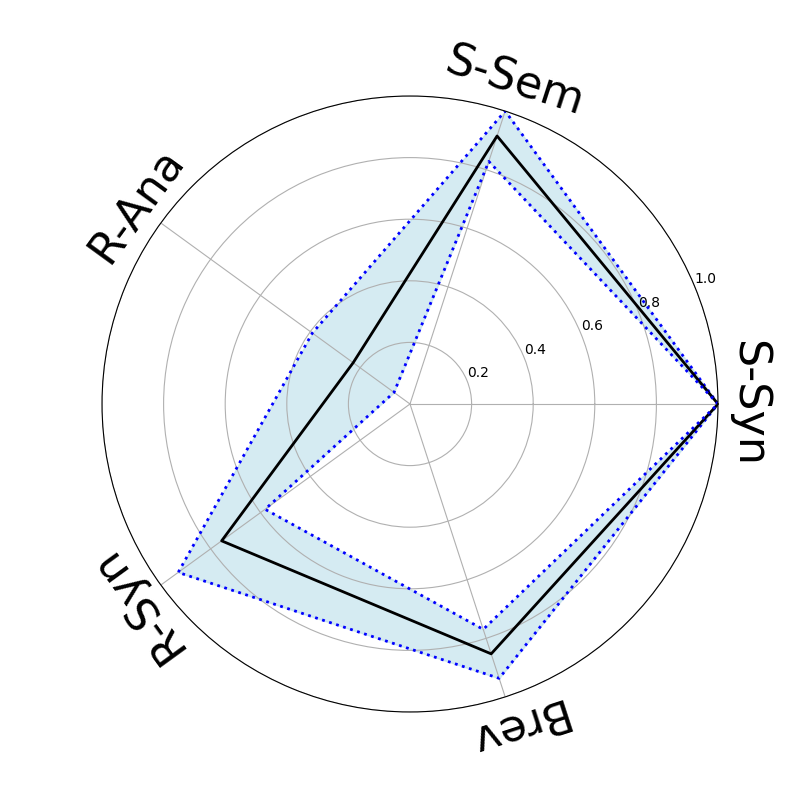
Dimensions of the Capability Compass

The capability Compass is organized around 5 dimensions, mainly for demonstration purposes of the new LLM-KG-Bench feature to aggregate scores:

  • RDF Syntax (R-Syn): Combination of several scores where the LLM has to work with syntax of RDF serialization formats
  • RDF Analytics (R-Ana): Combination of several scores of the different variations of RdfFriendCount task
  • SPARQL Semantics (S-Sem): Combination of Text2Sparql and several Sparql2Answer scores.
  • SPARQL Syntax (S-Syn): The results of SparqlSyntaxFixing task
  • Brevity (Brev): Combination of several scores evaluating whether the LLM returns only the information asked for. Additional text makes the parsing difficult and the generation cost additional computing resources.

In the plots, the mean value is indicated by the solid black line, and the blue area represents the variance.

open LLMs

The following table shows an overview of Capability Compass plots for open LLMs. Each line contains a LLM model family, the columns sort the LLMs according to their parameter count.

Family 0.5B 1B 1.5B 3B/3.8B 7B/8B MoE Active 6-14B 14B 32B/33B 70B/72B
Llama 3.0
--> Meta-Llama-3-8B-Instruct Meta-Llama-3-70B-Instruct
Llama 3.1
--> Llama-3.1-8B-Instruct Llama-3.1-70B-Instruct
Llama 3.2
--> Llama-3.2-1B-Instruct Llama-3.2-3B-Instruct
Llama 3.3
--> Llama-3.3-70B-Instruct
Phi 3.0
--> Phi-3-mini-128k-instruct Phi-3-small-128k-instruct Phi-3-medium-128k-instruct
Phi 3.5
--> Phi-3.5-mini-instruct Phi-3.5-MoE-instruct
Qwen2
--> Qwen2-0.5B-Instruct Qwen2-1.5B-Instruct Qwen2-7B-Instruct Qwen2-57B-A14B-Instruct Qwen2-72B-Instruct
Qwen2.5
--> Qwen2.5-0.5B-Instruct Qwen2.5-1.5B-Instruct Qwen2.5-3B-Instruct Qwen2.5-7B-Instruct Qwen2.5-14B-Instruct Qwen2.5-32B-Instruct Qwen2.5-72B-Instruct
Qwen2.5-Coder
--> Qwen2.5-Coder-32B-Instruct
Infly-OpenCoder
--> OpenCoder-8B-Instruct
Deepseek-coder
--> deepseek-coder-33b-instruct

Task Plots

Rdf Connection Explain Tasks

plot caption
RdfConnectionExplainStatic, graphFormat=jsonld: listTrimF1 score
RdfConnectionExplainStatic, graphFormat=nt: listTrimF1 score
RdfConnectionExplainStatic, graphFormat=turtle: listTrimF1 score
RdfConnectionExplainStatic, graphFormat=xml: listTrimF1 score

RDF Friend Count Tasks

plot caption
RdfFriendCount, graphFormat=jsonld, 1 additional link: F1 score
RdfFriendCount, graphFormat=jsonld, 2 additional links: F1 score
RdfFriendCount, graphFormat=nt, 1 additional link: F1 score
RdfFriendCount, graphFormat=nt, 2 additional links: F1 score
RdfFriendCount, graphFormat=turtle, 1 additional link: F1 score
RdfFriendCount, graphFormat=turtle, 2 additional links: F1 score
RdfFriendCount, graphFormat=xml, 1 additional link: F1 score
RdfFriendCount, graphFormat=xml, 2 additional links: F1 score

RDF Syntax Fix Tasks

plot caption
RdfSyntaxFixList, graphFormat=jsonld: max(combined) score
RdfSyntaxFixList, graphFormat=nt: max(combined) score
RdfSyntaxFixList, graphFormat=turtle: max(combined) score

SPARQL Syntax Fix Task

plot caption
SparqlSyntaxFixingList, dataset=LcQuad: max(combined) score

SPARQL to Answer Tasks

plot caption
Sparql2Answer, dataset=Organisational, graphFormat=jsonld: combinedF1 score
Sparql2Answer, dataset=Organisational, graphFormat=turtle: combinedF1 score

Text to Answer Tasks

plot caption
Text2Answer, dataset=Organisational, graphFormat=jsonld: combinedF1 score
Text2Answer, dataset=Organisational, graphFormat=turtle: combinedF1 score

Text to SPARQL Tasks

plot caption
Text2Sparql, dataset=Organizational, graphInfo=turtle graph: max(combined) score
Text2Sparql, dataset=Orga Numerical, graphInfo=turtle graph + ID-label-mapping: max(combined) score
Text2Sparql, dataset=Coypu Mini, graphInfo=turtle graph: max(combined) score
Text2Sparql, dataset=Beastiary, graphInfo=turtle schema: max(combined) score
Text2Sparql, dataset=Beastiary, graphInfo=turtle subschema: max(combined) score
Text2Sparql, dataset=Beastiary, graphInfo=turtle subgraph: max(combined) score